How to Select the Best Linear Regression Model for Statistics Assignments

Claim Your Offer
Unlock a fantastic deal at www.statisticsassignmenthelp.com with our latest offer. Get an incredible 10% off on all statistics assignment, ensuring quality help at a cheap price. Our expert team is ready to assist you, making your academic journey smoother and more affordable. Don't miss out on this opportunity to enhance your skills and save on your studies. Take advantage of our offer now and secure top-notch help for your statistics assignments.
We Accept


- Understanding Linear Regression and Model Selection
- What Is Linear Regression?
- Why Model Selection Matters in Assignments
- Methods for Selecting Variables in Regression Models
- Univariate Analysis as a Starting Point
- Stepwise Selection Techniques
- Criteria for Evaluating and Comparing Linear Regression Models
- Adjusted R-Squared
- Mallows' Cp Statistic
- Applying Model Selection Techniques Using Statistical Software
- Using SAS for Model Selection
- Other Software Options
- Interpreting the Final Model and Validation
- Understanding Coefficients and Significance
- Checking Model Assumptions and Validation
- Conclusion
Linear regression models are fundamental tools in statistics, allowing analysts and students alike to understand relationships between variables, make predictions, and infer underlying patterns. However, when it comes to building these models, choosing the most appropriate set of variables and the right model is crucial. Without careful model selection, your conclusions may be misleading or your predictions inaccurate.
This blog explores how to select the best linear regression model step-by-step, highlighting essential techniques and statistical criteria commonly used in statistical assignments. Whether you are handling multiple predictor variables, building models for the first time, or looking to solve your Linear Regression Assignment, understanding these concepts will help you create reliable models that effectively explain the data.

Understanding Linear Regression and Model Selection
Selecting the best linear regression model requires a solid understanding of what linear regression is and why model selection is necessary. Linear regression is used to describe how one or more predictor variables relate to an outcome variable in a linear fashion. However, not all predictors are equally useful, and including irrelevant or redundant variables can distort the model’s interpretation and predictive ability. Model selection involves deciding which variables to include, ensuring the model is both accurate and parsimonious. This balance improves clarity and reliability in statistical assignments, making your analysis more meaningful and easier to communicate.
What Is Linear Regression?
Linear regression is a statistical method used to model the relationship between a dependent variable (outcome) and one or more independent variables (predictors). The simplest case, simple linear regression, involves one predictor variable and fits a straight line that best describes the data. In multiple linear regression, multiple predictor variables are included to explain variations in the outcome.
The general form of a linear regression equation is:
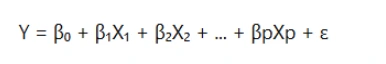
- Y is the dependent variable.
- X₁, X₂, ..., Xp are independent variables.
- β₀ is the intercept.
- β₁, β₂, ..., βp are coefficients that quantify the effect of each independent variable.
- ε is the error term, representing the variability unexplained by the model.
Why Model Selection Matters in Assignments
In practice, not all variables contribute meaningfully to explaining the dependent variable. Including irrelevant variables can:
- Increase model complexity unnecessarily.
- Reduce interpretability.
- Inflate variance of estimates.
- Lead to overfitting, where the model fits the training data well but performs poorly on new data.
On the other hand, excluding important predictors leads to underfitting, missing key relationships in the data.
Therefore, the goal is to find a parsimonious model — one that balances simplicity and explanatory power. This is especially important in statistics assignments, where demonstrating sound methodology and statistical reasoning is key.
Methods for Selecting Variables in Regression Models
Variable selection techniques are essential in building reliable regression models. Selecting the right subset of variables helps improve model accuracy, interpretability, and generalizability. There are multiple methods available, from simple univariate screening to more advanced automated procedures like stepwise regression. Each method has strengths and limitations, and combining approaches often yields the best results. Understanding how and when to apply these methods is critical for anyone working on regression-based assignments or research projects.
Univariate Analysis as a Starting Point
Before jumping into complex models, univariate analysis can help identify which variables may have a relationship with the outcome.
- How it works: Each predictor variable is analyzed separately against the dependent variable using simple linear regression.
- Purpose: This step screens out variables unlikely to be important in the final model.
- Example: If the p-value for a predictor is high (e.g., > 0.35), it suggests weak evidence of association and the variable may be dropped from further consideration.
Univariate screening is not foolproof, as some variables might become significant only when combined with others. Still, it serves as a useful preliminary filter, saving time and avoiding overcomplicated models.
Stepwise Selection Techniques
Stepwise regression is a popular method for selecting the best subset of variables. It automates adding or removing variables based on statistical criteria.
Forward Selection
- Starts with no variables in the model.
- Adds variables one by one.
- At each step, the variable that improves the model the most (often judged by the lowest p-value or highest adjusted R²) is added.
- Stops when no remaining variables meet the significance threshold for inclusion.
Backward Elimination
- Starts with all candidate variables in the model.
- Removes the least significant variable at each step.
- Stops when all remaining variables are significant.
Stepwise (Bidirectional) Selection
- Combines forward and backward methods.
- Variables can be added or removed at each step depending on their significance.
- Often considered more flexible and can avoid pitfalls of purely forward or backward methods.
Stepwise selection helps balance model fit with simplicity by iteratively choosing variables that contribute meaningfully.
Criteria for Evaluating and Comparing Linear Regression Models
Evaluating different regression models requires objective criteria that quantify how well the model fits the data while penalizing unnecessary complexity. Relying solely on measures like R-squared can be misleading because it increases with every added variable, regardless of its usefulness. More sophisticated criteria such as adjusted R-squared and Mallows’ Cp provide balanced metrics that help identify the best model for your data. Understanding these criteria enables you to critically assess your model choices and defend your selection in academic assignments.
Adjusted R-Squared
R-squared indicates the proportion of variance in the dependent variable explained by the model. However, it always increases when more variables are added, even if they are irrelevant.
Adjusted R-squared accounts for the number of predictors relative to the sample size:
- Interpretation: A higher adjusted R-squared indicates a better model.
- Use: When comparing models with different numbers of predictors, adjusted R-squared helps determine if adding a variable truly improves the model or just inflates the R-squared artificially.
For assignments, citing adjusted R-squared shows you understand the importance of penalizing complexity.
Mallows' Cp Statistic
Mallows’ Cp statistic is another measure used to assess model quality, particularly in variable selection contexts.
- Formula: Cp compares the precision and bias of a model relative to the full model.
- Interpretation: Ideally, Cp should be close to the number of predictors plus the intercept (p). Models with Cp near or below p have low bias and acceptable variance.
- Practical Use: In stepwise selection, the model with the smallest Cp near p is preferred.
Including Cp in your assignment demonstrates knowledge of advanced model selection criteria beyond basic R-squared values.
Applying Model Selection Techniques Using Statistical Software
Statistical software simplifies model selection by automating calculations and providing visual and numerical diagnostics. Tools like SAS, R, and Python support various variable selection methods and model evaluation criteria, making them indispensable for modern data analysis. Using these tools effectively can save time, reduce errors, and improve the robustness of your regression models. Familiarity with software-specific commands and outputs is crucial for producing quality statistical assignments and gaining practical data analysis skills.
Using SAS for Model Selection
SAS is widely used in academia and industry for regression modeling. It provides powerful procedures for variable selection:
- PROC REG with options for forward, backward, and stepwise selection.
- PROC GLMSELECT, designed for model selection in general linear models, supports advanced criteria like Cp, AIC, BIC.
Syntax Example:
proc reg data=dataset;
   model y = x1 x2 x3 x4 / selection=stepwise;
run;
SAS outputs detailed statistics including adjusted R-squared, Cp, and p-values to help select the best model.
Other Software Options
- R: The step() function performs stepwise model selection. Packages like leaps provide exhaustive subset selection.
- Python: Libraries like statsmodels allow for regression and manual variable selection; scikit-learn offers feature selection tools.
- Excel: While limited, Excel can perform regression with the Data Analysis Toolpak for simpler models.
Being proficient in software tools adds practical value to statistical assignments and allows for exploration of various models efficiently.
Interpreting the Final Model and Validation
Selecting the best model is only part of the process. Properly interpreting model coefficients and ensuring the underlying assumptions hold true are vital steps before drawing conclusions. Model validation, through residual diagnostics and performance evaluation on new data, confirms the model’s reliability and generalizability. This holistic approach from selection to validation strengthens the credibility of your statistical assignments and ensures that your analyses have practical significance.
Understanding Coefficients and Significance
Once the best model is selected, it’s essential to interpret:
- Coefficient estimates (βs): Indicate the expected change in the dependent variable per unit change in each predictor, holding others constant.
- Statistical significance (p-values): Variables with p-values less than a chosen threshold (commonly 0.05) are considered to have significant effects.
Clear interpretation links statistical output to real-world meaning, which is vital in assignments.
Checking Model Assumptions and Validation
Linear regression relies on several assumptions:
- Linearity: Relationship between predictors and outcome is linear.
- Independence: Observations are independent.
- Homoscedasticity: Constant variance of errors.
- Normality: Errors are normally distributed.
Violations can bias estimates and affect inference. Residual plots, normal probability plots, and statistical tests can be used to check these assumptions.
Validation techniques such as cross-validation or splitting data into training and testing sets help assess the model’s predictive performance on unseen data, ensuring it generalizes well.
Conclusion
Selecting the best linear regression model is a critical skill for completing statistics assignments that involve regression analysis. Beginning with univariate screening to identify promising variables, employing stepwise selection techniques to iteratively build the model, and using criteria like adjusted R-squared and Mallows’ Cp to evaluate competing models ensures a balance between complexity and explanatory power.
Incorporating statistical software streamlines the process, but it is the thoughtful interpretation and validation of the model that truly determines its usefulness. Understanding and applying these principles will not only improve the quality of your statistical assignments but also help you do your Statistics Assignment with greater confidence and precision.
By systematically applying these model selection strategies, you enhance the reliability of your analyses and contribute meaningful insights to your studies and future work.