How to Use Regression Analysis to Solve Applied Econometrics Assignments

Claim Your Offer
Unlock a fantastic deal at www.statisticsassignmenthelp.com with our latest offer. Get an incredible 10% off on all statistics assignment, ensuring quality help at a cheap price. Our expert team is ready to assist you, making your academic journey smoother and more affordable. Don't miss out on this opportunity to enhance your skills and save on your studies. Take advantage of our offer now and secure top-notch help for your statistics assignments.
We Accept


- Understanding the Core of Applied Econometrics Assignments
- Key Steps to Solving an Econometrics Assignment
- 1. Identifying the Research Question and Model Specification
- 3. Estimating and Interpreting the Regression Model
- 4. Making Predictions with the Model
- 5. Assessing Model Fit and Reliability
- 6. Handling Multiple Regression Models
- 7. Evaluating Model Validity and Limitations
- 8. Presenting Results in a Clear and Concise Manner
- Conclusion
Applied econometrics plays a crucial role in understanding economic relationships through statistical modeling. Students working on econometrics assignments often encounter tasks that involve analyzing datasets, specifying regression models, interpreting results, and evaluating model validity. These assignments are designed to enhance students' ability to work with real-world economic data and apply quantitative techniques to draw meaningful conclusions. A structured approach to solving these assignments is essential for producing accurate and well-articulated responses. To effectively complete your econometrics Assignments, students must develop a deep understanding of statistical tools and regression techniques. This blog will outline the key steps for approaching applied econometrics assignments, focusing on regression analysis and interpretation. It will cover critical aspects such as model specification, estimation, hypothesis testing, and diagnostic evaluation. By mastering these concepts, students can confidently analyze complex datasets, derive meaningful insights, and effectively communicate their findings in their coursework.
Understanding the Core of Applied Econometrics Assignments

Applied econometrics assignments often involve analyzing economic relationships using statistical models. These assignments require students to develop regression models, interpret coefficients, assess model assumptions, and critically analyze results. The problems typically revolve around real-world economic data, requiring the application of Ordinary Least Squares (OLS) regression, hypothesis testing, and statistical software such as Stata.
A structured approach to solving such assignments is essential for accuracy and clarity. Below is a theoretical framework to help students systematically tackle applied econometrics assignments while focusing on a sample assignment structure.
Key Steps to Solving an Econometrics Assignment
1. Identifying the Research Question and Model Specification
Every econometrics assignment begins with defining the relationship between economic variables. Consider the example of investigating how education influences fertility:
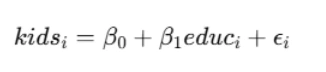
where:
kidsi represents the number of children ever born to a woman,
educi represents the years of education,
εi is the unobserved error term.
In such a model, the goal is to estimate β₁ to understand how education impacts fertility while considering factors in ε that might bias the results.
The error term ε often contains unobserved factors influencing the dependent variable. In this example, these may include:
- Socioeconomic background,
- Access to contraception,
- Cultural norms,
- Employment status,
- Geographic location.
Omitted variable bias arises if any of these factors correlate with education. The key condition for unbiased estimation is that ε must be uncorrelated with educ. Addressing potential biases involves using instrumental variables or additional control variables.
3. Estimating and Interpreting the Regression Model
Using OLS estimation, students obtain a regression equation. For instance, in a consumption function:
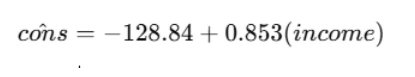
where:
The intercept (-128.84) represents consumption when income is zero,
The slope (0.853) indicates the marginal propensity to consume (MPC).
If the intercept is negative, interpretation should consider whether the model is extrapolating beyond meaningful income levels. Additionally, it is important to test whether these coefficients are statistically significant, typically by examining p-values and confidence intervals.
4. Making Predictions with the Model
Predictions are a crucial part of applied econometrics. Given an estimated model, students can predict outcomes for specific values. For instance, if family income is $30,000:
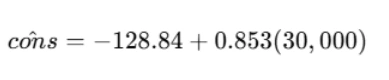
Interpreting such results in economic terms ensures clarity in answering assignment questions. It is also important to assess whether these predictions align with economic intuition and existing literature.
5. Assessing Model Fit and Reliability
Econometrics assignments often require evaluating model fit using:
- R-squared: Indicates the proportion of variance explained by the model.
- Residual analysis: Ensures errors are randomly distributed.
- F-statistics and t-tests: Assess the significance of coefficients.
- Adjusted R-squared: A modified version of R-squared that accounts for the number of predictors in the model.
For instance, if 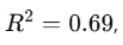 this means that 69% of variation in consumption is explained by income. However, a high R-squared does not necessarily indicate causality, so additional robustness checks are required.
6. Handling Multiple Regression Models
Many assignments extend simple regressions to include multiple predictors. For example, analyzing participation in a 401(K) plan based on employer contributions:
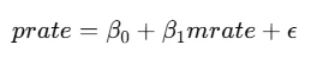
where:
prate is the percentage of eligible workers with active accounts,
mrate is the employer match rate per dollar.
Key steps include:
- Computing descriptive statistics (mean participation rate, mean match rate),
- Estimating OLS coefficients,
- Interpreting results (e.g., if higher match rates encourage participation),
- Checking for multicollinearity using Variance Inflation Factors (VIF),
- Testing for interaction effects to see if relationships vary by subgroup.
7. Evaluating Model Validity and Limitations
Assignments require students to consider:
- Heteroscedasticity: Unequal variance in residuals can bias standard errors.
- Multicollinearity: High correlation among independent variables distorts coefficient estimates.
- Endogeneity: Reverse causality or omitted variables require instrumental variable techniques.
- Autocorrelation: If errors are correlated over time, robust standard errors should be used.
- Specification errors: Incorrect functional forms may lead to misleading results.
8. Presenting Results in a Clear and Concise Manner
When writing assignments, students should:
- Clearly define hypotheses and models,
- Report regression tables neatly,
- Use proper economic interpretation,
- Include well-labeled graphs for better visualization,
- Explain limitations and suggest improvements for future research.
Conclusion
Solving applied econometrics assignments involves a structured approach—starting from model specification to estimation, interpretation, and evaluation. Understanding omitted variable bias, statistical inference, and regression diagnostics ensures robust and meaningful analysis. By mastering these concepts, students can confidently navigate assignments requiring economic data analysis, OLS estimation, and hypothesis testing. Furthermore, attention to detail in presenting results enhances clarity and credibility in econometric studies. To effectively solve your statistics assignment, students must apply statistical reasoning and computational techniques with precision. With consistent practice and application of econometric principles, students can develop strong analytical skills essential for academic and professional success. The ability to interpret and present statistical findings in a structured manner further strengthens the quality of analysis. By honing these skills, students will be well-prepared to tackle complex statistical and econometric problems with confidence, ensuring they achieve excellence in their coursework and future careers.