How to Approach Statistics Assignments Involving Control Charts
Claim Your Offer
Unlock a fantastic deal at www.statisticsassignmenthelp.com with our latest offer. Get an incredible 10% off on all statistics assignment, ensuring quality help at a cheap price. Our expert team is ready to assist you, making your academic journey smoother and more affordable. Don't miss out on this opportunity to enhance your skills and save on your studies. Take advantage of our offer now and secure top-notch help for your statistics assignments.
We Accept


- Understanding Control Charts in Quality Control
- Identifying the Type of Control Chart Required
- Steps to Construct a Fraction Nonconforming Control Chart
- Determining Sample Size for a Positive Lower Control Limit
- Evaluating Process Shifts
- Handling Multiple Sample Sizes
- Common Mistakes to Avoid in Control Chart Assignments
- Advanced Considerations in Control Chart Assignments
- Conclusion
Control charts play a vital role in statistical quality control, providing a structured approach to monitoring and improving processes. They help detect variations, identify potential issues, and ensure processes remain stable over time. Control charts are widely used in industries such as manufacturing, healthcare, and service sectors to track performance and maintain quality standards. When working on statistics assignments involving control charts, students must understand the types of charts, how to calculate control limits, interpret the results, and make necessary adjustments. These assignments require a blend of theoretical knowledge and practical application, often involving calculations, graphical representations, and analytical thinking. Understanding the steps to construct and analyze control charts is essential for accurately completing such assignments. This blog explores a step-by-step approach to solving control chart assignments, helping you complete your Control Charts assignment efficiently while discussing sample size considerations, probability analysis, and common errors to avoid.
Understanding Control Charts in Quality Control

Control charts are a fundamental tool in statistical quality control, used to monitor the stability of processes over time. They help in identifying variations, determining whether a process is in control, and deciding if corrective action is necessary. These charts visually represent process performance, allowing analysts to differentiate between common cause variations, which are inherent to the process, and special cause variations, which indicate external disturbances.
Assignments involving control charts often require students to construct, interpret, and revise control limits based on given sample data. This involves calculating control limits, analyzing trends, and making data-driven decisions. Control charts are especially valuable in quality control because they provide a systematic approach to detecting deviations from expected performance. Understanding these charts is essential for students tackling statistics assignments in quality control, as they form the basis for ensuring product consistency, process efficiency, and adherence to industry standards. Mastery of control charts enhances students' ability to apply statistical methods in real-world quality management scenarios.
Identifying the Type of Control Chart Required
Before solving a control chart assignment, it is crucial to determine the type of chart needed. The type of data provided will guide this choice:
- p-chart (Fraction Nonconforming Chart): Used when monitoring the proportion of defective units in a sample.
- np-chart: Used when monitoring the number of defective units, given a constant sample size.
- c-chart: Suitable when counting the number of defects per unit.
- u-chart: Used when monitoring defects per unit when the sample size varies.
For most quality control assignments, the p-chart is common as it monitors the fraction of nonconforming items in a sample.
Steps to Construct a Fraction Nonconforming Control Chart
When tasked with constructing a fraction nonconforming control chart, follow these steps:
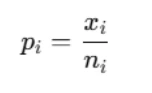
Step 1: Calculate the Fraction Nonconforming for Each Sample
For each sample, compute the proportion of defective units using the formula:
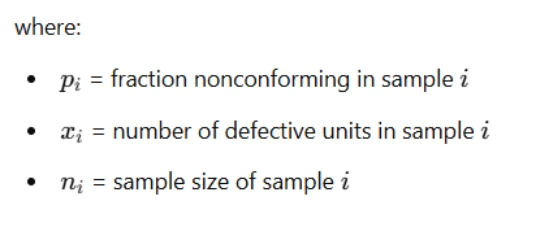
Step 2: Determine the Overall Average Fraction Nonconforming
The overall proportion of defective units across all samples is calculated as:
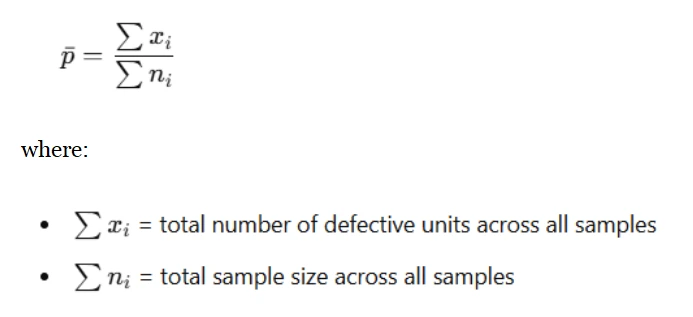
Step 3: Calculate Control Limits
Control limits help in determining whether a process is within acceptable variation. The upper control limit (UCL) and lower control limit (LCL) for a p-chart are given by:
If the LCL is negative, it is set to zero since a negative proportion is not possible.
Step 4: Plot the Control Chart
- The horizontal axis represents the sample number.
- The vertical axis represents the fraction nonconforming.
- Plot each sample proportion nonconforming.
- Draw the average line (p) and control limits (UCL and LCL).
Step 5: Analyze the Control Chart
Interpret the chart by examining whether any points fall outside the control limits:
- If all points are within limits, the process is in control.
- If points fall outside the limits, identify and investigate potential assignable causes.
- Recalculate control limits if necessary.
Determining Sample Size for a Positive Lower Control Limit
To ensure the LCL is positive, the sample size must be large enough. A positive LCL is possible when:
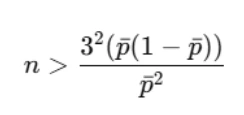
Using this formula, students can determine the smallest sample size necessary to maintain a meaningful control chart.
Evaluating Process Shifts
Control charts are often used to detect shifts in the process quality. If a shift occurs, such as an increase in the fraction nonconforming to 0.30, the probability of detecting this shift on the first sample can be found using the power of a control chart:
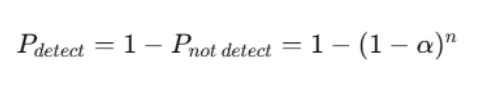
Where x is the probability of detecting a defect in a single observation.
Handling Multiple Sample Sizes
Some assignments may require control charts for multiple sample sizes. In such cases:
- Calculate separate control limits for each sample size.
- Overlay the limits on a single control chart.
- Use standardized control charts to simplify interpretation.
Common Mistakes to Avoid in Control Chart Assignments
- Misidentifying the chart type: Ensure the correct control chart is used based on the data.
- Incorrect calculations: Errors in computing and control limits can lead to incorrect conclusions.
- Ignoring sample size variations: If sample sizes differ, adjustments to control limits are necessary.
- Overlooking assignable causes: When points fall outside control limits, investigate rather than assume random variation.
Advanced Considerations in Control Chart Assignments
- Adjusting for Process Improvements: If a process improvement reduces the fraction nonconforming, update control limits accordingly.
- Effect of Sample Size on Detection Sensitivity: Larger sample sizes improve sensitivity but increase data collection costs.
- Interpreting Run Patterns: Consecutive points near control limits may indicate trends needing attention.
- Accounting for Natural Variability: Ensure that minor fluctuations within control limits do not lead to unnecessary process changes.
Conclusion
Solving control chart assignments requires a structured approach: identifying the right chart, computing necessary statistics, plotting data, and interpreting results. By following these steps, students can efficiently solve your statistics assignment while gaining valuable insights into process control. Understanding their concepts allows students to analyze quality control processes effectively, make informed decisions, and recognize patterns that indicate process shifts. Mastering control chart analysis is a crucial skill for quality control professionals and statisticians, ensuring that processes remain stable and improvements are implemented effectively. By applying the right methodologies and avoiding common errors, students can enhance their problem-solving abilities and confidently handle control chart assignments.