How to Use Wald Chi-Square Test for Variable Selection in Logistic Regression Assignments

Claim Your Offer
Unlock a fantastic deal at www.statisticsassignmenthelp.com with our latest offer. Get an incredible 10% off on all statistics assignment, ensuring quality help at a cheap price. Our expert team is ready to assist you, making your academic journey smoother and more affordable. Don't miss out on this opportunity to enhance your skills and save on your studies. Take advantage of our offer now and secure top-notch help for your statistics assignments.
We Accept


- Understanding the Wald Chi-Square Test
- What Is the Wald Test in Logistic Regression?
- Why Use the Wald Chi-Square Test for Variable Selection?
- Performing Wald Chi-Square Test in R
- How to Use glm() Function for Logistic Regression
- How to Interpret the summary() Output
- Interpreting Wald Chi-Square Results in Assignments
- What a High Wald Statistic Indicates
- What a Low Wald Statistic Means
- Advantages and Limitations of Using the Wald Test
- Strengths of the Wald Chi-Square Test
- Limitations Students Should Be Aware Of
- Best Practices for Logistic Regression Assignments Using Wald Test
- How to Combine Wald Test with Stepwise Selection
- How to Report Wald Test Results in Assignments
- Conclusion
Logistic regression is a powerful statistical method used for modeling binary outcome variables. Whether you're analyzing the success/failure of a product launch or the presence/absence of a disease, logistic regression helps make sense of complex relationships. However, selecting the right predictor variables is just as important as building the model itself. One common method for variable selection is the Wald Chi-Square Test.
This blog will help students understand how to use the Wald Chi-Square Test for selecting variables when performing logistic regression assignments. If you’re looking to do your logistic regression assignment accurately and effectively, understanding this test is crucial. It provides a deep dive into the theory, computation, interpretation, and application of this method in statistical modeling.
Understanding the Wald Chi-Square Test
The Wald Chi-Square Test is a fundamental technique used to test whether the coefficient of a predictor variable is significantly different from zero in logistic regression models. When working on assignments that require building such models, students need to determine which variables contribute meaningfully to the outcome. The Wald test offers a simple yet powerful method to assess individual predictor significance. It uses the estimated coefficient and its standard error to compute a test statistic, which is then compared against a chi-square distribution to derive a p-value. This allows for evidence-based variable inclusion or exclusion in the model.

What Is the Wald Test in Logistic Regression?
The Wald test is used to assess the significance of individual coefficients in a logistic regression model. Specifically, it tests the null hypothesis that a coefficient (β) is equal to zero, which implies the corresponding predictor variable has no effect on the outcome variable.
The Wald statistic is calculated as:
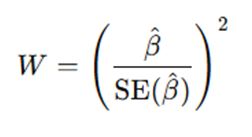
Where:
- β^ is the estimated coefficient.
- SE(β^) is the standard error of the estimate.
This statistic follows a chi-square distribution with one degree of freedom under the null hypothesis.
This statistic follows a chi-square distribution with one degree of freedom under the null hypothesis.
Why Use the Wald Chi-Square Test for Variable Selection?
The Wald test is popular in logistic regression for the following reasons:
- Efficiency: It is straightforward to compute.
- Interpretability: The p-value associated with the test indicates the statistical significance of the variable.
- Automation: Most statistical software (like R, SAS, SPSS) reports the Wald statistics by default when fitting a logistic regression model.
Performing Wald Chi-Square Test in R
Performing the Wald Chi-Square Test in R is an essential skill for students working on logistic regression tasks. R’s glm() function makes it easy to fit logistic regression models, while the summary() function provides the output needed to evaluate predictor significance. This includes coefficient estimates, standard errors, test statistics, and p-values. Assignments often require not just running the test, but also interpreting its output accurately. Understanding the syntax and knowing where to look for results is important for producing correct, well-explained assignment submissions that demonstrate both computational and statistical competence.
How to Use glm() Function for Logistic Regression
In R, logistic regression is performed using the glm() function with the family set to binomial. For example:
model <- glm(outcome ~ predictor1 + predictor2 + predictor3,
This model fits a logistic regression to the data. Each coefficient estimate will be tested using the Wald test by default.
How to Interpret the summary() Output
To obtain the Wald Chi-Square statistics and p-values, use the summary() function:
summary(model)This gives:
- Coefficient estimates (Estimate)
- Standard errors (Std. Error)
- Wald z-values (z value)
- Corresponding p-values (Pr(>|z|))
A variable is typically considered significant if the p-value is less than 0.05.
Interpreting Wald Chi-Square Results in Assignments
Interpreting the Wald test results correctly is crucial for drawing meaningful conclusions in statistics assignments. A high Wald statistic with a low p-value indicates strong evidence that the predictor influences the outcome and should be included in the model. Conversely, a low statistic and high p-value suggest weak or no contribution. Students must also be cautious, as factors like sample size, multicollinearity, or data quality can affect these results. When writing assignments, clear interpretation backed by correct statistical reasoning can significantly improve the quality and credibility of your regression analysis.
What a High Wald Statistic Indicates
A high Wald statistic (and a low p-value) suggests that the predictor variable has a significant effect on the outcome variable. This implies the variable should be retained in the model.
For example:
| Predictor | Estimate | Std. Error | z value | Pr(>|z|) |
|---|---|---|---|---|
| Age | 1.25 | 0.40 | 3.125 | 0.0018 |
In this case, Age is statistically significant and should be included.
What a Low Wald Statistic Means
A low Wald statistic (and a high p-value) suggests that the predictor variable may not contribute much to the model. However, this does not necessarily mean it should always be excluded. Factors such as multicollinearity or domain relevance should also be considered.
For instance:
| Predictor | Estimate | Std. Error | z value | Pr(>|z|) |
|---|---|---|---|---|
| Gender | 0.15 | 0.21 | 0.714 | 0.4756 |
Here, Gender may not be statistically significant on its own and could be a candidate for exclusion.
Advantages and Limitations of Using the Wald Test
Like all statistical tools, the Wald Chi-Square Test comes with both strengths and limitations. Its simplicity and availability make it a favorite choice in academic assignments and applied modeling. However, students must be aware of its weaknesses—especially its unreliability in models with high multicollinearity or when coefficients are large and unstable. Relying solely on this test can lead to incorrect conclusions. Hence, it should be used as part of a broader variable selection strategy. Recognizing where the Wald test shines and where it falls short is key to building robust logistic regression models.
Strengths of the Wald Chi-Square Test
Some of the key benefits of using the Wald test for assignments include:
- Simple and intuitive: Students can easily interpret the output from R or any software.
- Standardized output: The Wald test is part of most regression summaries, so no extra computation is needed.
- Quick decision-making: Helps in preliminary variable screening based on statistical significance.
Limitations Students Should Be Aware Of
Despite its advantages, the Wald test also has several limitations:
- Unreliable when coefficients are large: The test can perform poorly when the coefficient estimate is large or the standard error is inflated.
- Affected by multicollinearity: If predictors are correlated, the standard error increases, leading to misleading p-values.
- Not the only criterion: Variables with high p-values might still be important due to theoretical or contextual reasons.
Students should consider supplementing the Wald test with other variable selection methods such as likelihood ratio tests, AIC/BIC, or stepwise regression.
Best Practices for Logistic Regression Assignments Using Wald Test
To perform well in assignments, students must go beyond running basic tests—they must apply best practices for accurate and defensible results. This includes using the Wald test in conjunction with other tools like stepwise regression, likelihood ratio tests, or penalized regression methods. Additionally, how results are presented in reports plays a significant role. Well-structured tables, correct interpretations, and justified decisions about variable selection show a deep understanding of logistic regression modeling. These best practices will not only improve assignment grades but also build a solid foundation for statistical analysis in academic and professional settings.
How to Combine Wald Test with Stepwise Selection
Stepwise selection methods (both forward and backward) often use the Wald p-value as a decision rule for adding or removing predictors. In R, step() can be used for automatic model selection:
step(model, direction = "backward")This will remove variables one at a time based on statistical criteria (AIC by default), often corresponding to variables with high p-values (low Wald statistics).
How to Report Wald Test Results in Assignments
When writing reports for your statistics assignments, clearly state:
- Which variables were tested.
- The Wald statistic and associated p-value.
- The decision to include or exclude the variable.
- Justification if a non-significant variable was retained based on theory or past research.
Example: "The Wald test showed that 'Income Level' had a p-value of 0.03, indicating a significant association with the response variable. Therefore, it was retained in the final model."
Conclusion
The Wald Chi-Square Test is a widely used method in logistic regression to evaluate the significance of individual predictors. For students working on statistics assignments, it provides a straightforward way to identify which variables contribute meaningfully to the model. However, relying solely on this test may not always be advisable due to issues such as multicollinearity and inflated standard errors.
In practice, the Wald test is best used in conjunction with other selection techniques such as stepwise regression, likelihood ratio tests, and domain knowledge. Understanding its strengths and limitations can significantly improve the quality and clarity of your regression assignments. If you’re looking to solve your statistics assignment with precision, applying the Wald test alongside other robust methods can make your model more reliable and insightful.
By learning how to perform and interpret the Wald Chi-Square Test, students will be better equipped to make informed decisions about variable inclusion and produce statistically sound, concise, and interpretable models.