How to Apply the Independent t-Test in Statistics Assignments

Claim Your Offer
Unlock a fantastic deal at www.statisticsassignmenthelp.com with our latest offer. Get an incredible 10% off on all statistics assignment, ensuring quality help at a cheap price. Our expert team is ready to assist you, making your academic journey smoother and more affordable. Don't miss out on this opportunity to enhance your skills and save on your studies. Take advantage of our offer now and secure top-notch help for your statistics assignments.
We Accept


- Understanding the Independent t-Test
- When to Use the Independent t-Test
- Key Assumptions of the Independent t-Test
- Steps to Perform an Independent t-Test
- Formulating Hypotheses
- Calculating the t-Statistic
- Interpreting the Results
- Comparing the t-Value to the Critical Value
- Understanding the p-Value
- Effect Size Measurement
- Common Mistakes in Applying the Independent t-Test
- Ignoring Assumption Checks
- Misinterpreting the p-Value
- Using the Wrong Type of t-Test
- Conclusion
Statistics assignments frequently require students to analyze and compare data sets to draw meaningful conclusions, often presenting challenges that demand careful statistical analysis. One of the most essential tools for this purpose is the independent t-test, a fundamental statistical method used to determine whether there is a significant difference between the means of two unrelated groups. Whether you're examining test scores between different classrooms, comparing sales figures across regions, or evaluating experimental versus control groups in scientific research, this test provides a reliable way to solve your statistics assignment problems involving group comparisons. This blog provides a comprehensive guide on how to correctly apply the independent t-test in your statistics assignments, covering its key assumptions, step-by-step execution, proper interpretation of results, and common pitfalls to avoid. By mastering this technique, you'll be better equipped to handle hypothesis testing requirements in your coursework while developing crucial analytical skills for academic and professional applications. Understanding when and how to use this test properly can make the difference between accurate conclusions and flawed interpretations in your statistical analyses.
Understanding the Independent t-Test

The independent t-test, also known as the two-sample t-test, is a parametric test that compares the means of two independent groups. It is widely used in academic research, business analytics, and scientific studies to test hypotheses about population means when the data meets specific conditions.
When to Use the Independent t-Test
This test is appropriate in the following scenarios:
- Continuous Dependent Variable: The outcome being measured (e.g., test scores, blood pressure, sales figures) should be continuous.
- Two Independent Groups: The groups being compared must be distinct and unrelated (e.g., male vs. female, control vs. experimental group).
- Normally Distributed Data: The data in each group should follow a normal distribution, especially for small sample sizes.
- Equal Variances (Homoscedasticity): The variances of the two groups should be approximately equal.
If these assumptions are not met, alternative tests such as the Mann-Whitney U test (a non-parametric equivalent) should be considered.
Key Assumptions of the Independent t-Test
Before performing the test, it is crucial to verify the following assumptions:
- Normality
- The data in each group should be normally distributed.
- For small samples (n < 30), use the Shapiro-Wilk test or Kolmogorov-Smirnov test to check normality.
- For larger samples (n ≥ 30), the Central Limit Theorem ensures normality, making the test more robust.
- Homogeneity of Variance
- The variances of the two groups should be similar.
- This can be checked using Levene’s test or Bartlett’s test.
- If variances are unequal, use Welch’s t-test, an adaptation that does not assume equal variances.
- Independence of Observations
- The data points in one group should not influence those in the other group.
- If observations are paired (e.g., before-and-after measurements), a paired t-test should be used instead.
Failing to meet these assumptions can lead to incorrect conclusions, so preliminary checks are essential.
Steps to Perform an Independent t-Test
Conducting an independent t-test involves several structured steps, from hypothesis formulation to result interpretation.
Formulating Hypotheses
The first step is to establish the null hypothesis (H₀) and the alternative hypothesis (H₁):
- Null Hypothesis (H₀): There is no significant difference between the two group means (μ₁ = μ₂).
- Alternative Hypothesis (H₁): There is a significant difference between the two group means (μ₁ ≠ μ₂).
A two-tailed test is standard unless prior research suggests a specific direction (e.g., one group is expected to have a higher mean).
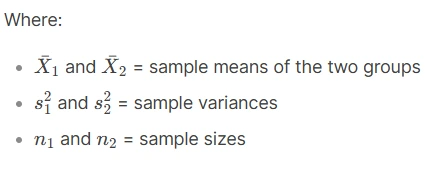
Calculating the t-Statistic
The t-statistic is computed using the following formula:
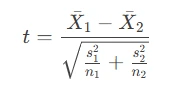
The degrees of freedom (df) for the test are calculated as:
df = n₁ + n₂ - 2
This value is used to determine the critical t-value from the t-distribution table.
Interpreting the Results
After computing the t-value, the next step is to interpret whether the difference between the groups is statistically significant.
Comparing the t-Value to the Critical Value
- If the absolute value of t (∣t∣) is greater than the critical t-value (from the t-distribution table), the null hypothesis is rejected.
- If ∣t∣ is less than or equal to the critical value, the null hypothesis is not rejected.
Understanding the p-Value
The p-value indicates the probability of observing the data if the null hypothesis were true.
- p < 0.05: The difference is statistically significant (reject H₀).
- p ≥ 0.05: The difference is not statistically significant (fail to reject H₀).
It is best practice to report the exact p-value (e.g., p = 0.023) rather than just stating significance.
Effect Size Measurement
A significant p-value does not indicate the magnitude of the difference. To assess practical significance, calculate Cohen’s d:
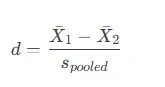
Where spooled is the pooled standard deviation.
- d ≈ 0.2: Small effect
- d ≈ 0.5: Medium effect
- d ≈ 0.8: Large effect
This helps determine whether the observed difference is meaningful in real-world terms.
Common Mistakes in Applying the Independent t-Test
Students often make errors when performing the independent t-test, leading to incorrect conclusions. Below are some common pitfalls and how to avoid them.
Ignoring Assumption Checks
Many students skip checking for normality and homogeneity of variance, which can invalidate results.
Solution: Always perform Shapiro-Wilk (for normality) and Levene’s test (for equal variances) before running the t-test.
If assumptions are violated, use non-parametric alternatives like the Mann-Whitney U test.
Misinterpreting the p-Value
A small p-value does not necessarily mean the effect is large or important.
Solution: Always report effect size (Cohen’s d) alongside the p-value to provide context.
Using the Wrong Type of t-Test
Some students mistakenly apply an independent t-test when a paired t-test is needed (e.g., pre-test vs. post-test data).
Solution: Determine whether the groups are independent or related before choosing the test.
Conclusion
The independent t-test is a fundamental statistical tool for comparing two group means in research and assignments. By ensuring that the data meets key assumptions, correctly calculating the t-statistic, and interpreting results with both statistical significance (p-value) and practical significance (effect size), students can draw accurate and meaningful conclusions.
Avoiding common mistakes—such as skipping assumption checks or misinterpreting p-values—will strengthen the validity of your analysis. Whether you are working on a psychology experiment, business analytics project, or medical research, mastering the independent t-test is essential for robust statistical reasoning.
By following this structured approach, students can confidently apply the independent t-test in their statistics assignments, ensuring reliable and well-supported findings.