How to Approach Statistical Assignments Involving Probability, Confidence Intervals, and Hypothesis Testing

Claim Your Offer
Unlock a fantastic deal at www.statisticsassignmenthelp.com with our latest offer. Get an incredible 10% off on all statistics assignment, ensuring quality help at a cheap price. Our expert team is ready to assist you, making your academic journey smoother and more affordable. Don't miss out on this opportunity to enhance your skills and save on your studies. Take advantage of our offer now and secure top-notch help for your statistics assignments.
We Accept


- Understanding Conditional Probability and Interpretation
- Constructing and Interpreting Confidence Intervals
- Hypothesis Testing for Statistical Claims
- Addressing Skewness in Data Distributions
- Quality Control and Sampling Techniques
- Conclusion
Statistical assignments often require students to analyze data using probability concepts, confidence intervals, hypothesis testing, and other inferential techniques. Assignments of this nature typically involve interpreting conditional probabilities, constructing confidence intervals, and assessing statistical claims. These tasks require a strong understanding of statistical methods and their real-world applications. Students must not only perform numerical calculations but also interpret their results correctly to draw meaningful conclusions. Additionally, knowing when and how to apply different statistical techniques is crucial for accurate data analysis. For instance, hypothesis testing helps determine if a sample statistic significantly deviates from an assumed population parameter, while confidence intervals provide a range for estimating unknown parameters. Probability concepts, including conditional probability, enable students to assess the likelihood of various outcomes given certain conditions. Whether you need to solve your Hypothesis Testing assignment or understand statistical principles better, this blog will discuss how to systematically approach such assignments, using relevant examples to illustrate key concepts and improve comprehension.
Understanding Conditional Probability and Interpretation

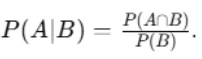
Conditional probability measures the likelihood of an event occurring given that another event has already occurred. Assignments may present conditional probability statements and ask students to interpret them correctly. For example:
- Given that P (A|B) = 0.87, students must determine the correct interpretation. This probability means that if event B has occurred, then event A will occur with an 87% chance.
- A common mistake is misinterpreting the probability P (B|A) as instead of P (A|B). To avoid errors, students should clearly define what each probability represents.
Steps to Solve Conditional Probability Problems
- Identify the given conditional probability and the events involved.
- Use the definition:
- Translate the probability statement into real-world terms to confirm the correct interpretation.
- If necessary, use Bayes' Theorem to reverse probabilities when additional data is provided.
- Always consider the total number of individuals or samples involved when interpreting percentages and probabilities.
Constructing and Interpreting Confidence Intervals
Confidence intervals (CIs) provide a range within which a population parameter is likely to fall. Assignments often require students to compute CIs for population means or proportions.
For example, given:
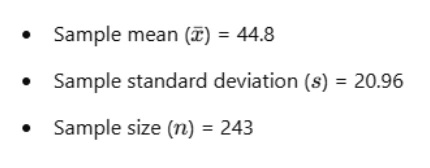
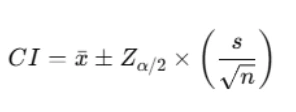
The 95% CI for the population mean is calculated as:
Steps to Compute a Confidence Interval
- Determine the sample mean (x) and standard deviation (s).
- Identify the confidence level and find the corresponding Z-score (e.g., 1.96 for 95%).
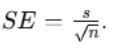
- Compute the standard error:
- Calculate the margin of error:

- Construct the interval:

- Interpret the interval: If the confidence level is 95%, we are 95% confident that the population mean lies within this range.
Hypothesis Testing for Statistical Claims
Hypothesis testing is used to determine whether a claim about a population is supported by sample data. Common problems involve assessing whether a sample mean significantly differs from a population mean.
For example:
- A company’s sales data is normally distributed with a mean of $9300 and a standard deviation of $750.
- An employee’s sales for the month are $5800.
- The task is to determine whether this value is unusually low.
Steps for Hypothesis Testing
- State the Hypotheses
- Null Hypothesis (H0): The employee’s sales are not significantly different from the company’s average.
- Alternative Hypothesis (Ha): The employee’s sales are unusually low.
- Compute the Z-Score
- Compare to Critical Values
- If |Z| exceeds the critical value (e.g., 1.96 for a 95% confidence level), reject H0.
- Otherwise, there is insufficient evidence to declare the sales unusually low.
- Interpret the Results
- If the hypothesis is rejected, conclude that Bill’s sales are significantly lower than expected.
- If not rejected, conclude that the sales are within the expected range, even if lower than average.
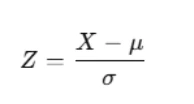
where X= 5800, u= 9300, and σ = 750.
Addressing Skewness in Data Distributions
Some assignments ask whether a hypothesis test remains valid if the data distribution is skewed. If the assumption of normality is violated:
- The Central Limit Theorem (CLT) states that for large samples (n>30), the sampling distribution of the mean is approximately normal.
- If n is small and the data is skewed, non-parametric tests such as the Wilcoxon Rank-Sum test may be more appropriate.
- Students should assess skewness using visual methods (histograms, boxplots) and numerical tests (Shapiro-Wilk test).
Evaluating Statistical Claims
Assignments often present real-world statistical claims and ask whether they are justified. Consider the following example:
- A sociologist states that since the mean cost of dinner in two different locations differs by $11, the population means must also differ.
- To assess this claim, a hypothesis test should be performed rather than relying on sample means alone.
Correct Approach
- Formulate hypotheses:
- H0: There is no significant difference in population means.
- Ha: There is a significant difference in population means.
- Compute the test statistic (e.g., a two-sample t-test if variances are unknown).
- Compare to the critical value and determine statistical significance.
- Interpret results to determine whether the difference is meaningful beyond sample variation.
Quality Control and Sampling Techniques
Sampling is essential in quality control to assess whether a process meets industry standards. A classic example involves the Trial of the Pyx, where historical coin samples were tested for weight consistency.
Steps for Process Control Evaluation
- Define the Acceptable Range
- If a sample mean falls within the predetermined tolerance, the process is in control.
- Use the Central Limit Theorem
- If sample sizes are large, the total weight distribution follows a normal curve.
- Calculate Probabilities
- Use normal probability calculations to determine whether the sample falls within limits.
- Make Adjustments if Necessary
- If a process is found to be out of control, recalibrate measurements and retest.
Conclusion
Solving statistical assignments requires understanding probability, confidence intervals, hypothesis testing, and sampling techniques to complete your statistics assignment successfully. By following structured problem-solving steps, students can accurately interpret statistical results and justify their conclusions. Whether evaluating conditional probabilities, constructing confidence intervals, or testing hypotheses, careful analysis and a logical approach ensure accurate and meaningful insights. By mastering these concepts, students will be better equipped to complete their statistics assignment effectively and make informed data-driven decisions in real-world scenarios.