How to Approach Statistics Assignments Involving Global Food Market Analysis

Claim Your Offer
Unlock a fantastic deal at www.statisticsassignmenthelp.com with our latest offer. Get an incredible 10% off on all statistics assignment, ensuring quality help at a cheap price. Our expert team is ready to assist you, making your academic journey smoother and more affordable. Don't miss out on this opportunity to enhance your skills and save on your studies. Take advantage of our offer now and secure top-notch help for your statistics assignments.
We Accept


- Understanding Market Shocks and Price Behavior in Statistical Terms
- Interpreting Demand and Supply Dynamics Using Statistical Models
- Discussing the Role of Inelastic Demand in Price Volatility
- Analyzing Global Price Indices and Their Implications
- Distinguishing Between Price Levels and Price Volatility
- Understanding the Impact of Price Changes on Different Economic Agents
- Applying Trade Theory and Policy Evaluation to Food Markets
- Evaluating Absolute and Comparative Advantage Through Labor Data
- Assessing the Effects of Trade Policy Using Welfare Analysis
- Exploring Value Chains and Information Asymmetry in Food Systems
- Understanding Traditional vs. Modern Value Chains
- Investigating the Statistical Implications of Information Asymmetry
- Conclusion
In today’s interconnected world, statistics play a vital role in understanding trends, shocks, and policies within the global food market. Assignments related to this topic can seem overwhelming because they demand an interdisciplinary understanding of economics, international trade, agriculture, and statistical analysis. However, students can confidently handle such tasks if they follow a clear, analytical approach grounded in core statistical thinking.
Global food market statistics assignments often combine theoretical concepts with real-world datasets, policy evaluation, and market behavior interpretation. From rice price indices to food security and trade dynamics, these assignments challenge students to interpret statistical findings while contextualizing them in economic realities.
Below is a structured breakdown of how to approach such assignments effectively, without being lost in complex mathematical jargon or overwhelmed by market-specific terminology. Below is a structured breakdown of how to approach such assignments effectively, without being lost in complex mathematical jargon or overwhelmed by market-specific terminology. This guide will help you solve your statistics assignment with clarity, especially when it involves the intricate dynamics of the global food market.

Understanding Market Shocks and Price Behavior in Statistical Terms
Assignments related to global food markets often include scenarios where unexpected events—such as natural disasters or geopolitical crises—disrupt agricultural production. These shocks lead to changes in the supply and demand dynamics of staple foods like rice, wheat, or maize. To approach such tasks, students must grasp the underlying economic behavior using simple statistical language and models. While these questions may appear theoretical, they rely heavily on accurate interpretation of how markets respond. Understanding elasticity, market equilibrium, and price transmission is key. Assignments in this area often assess your ability to analyze and describe market fluctuations using applied statistical reasoning.
Interpreting Demand and Supply Dynamics Using Statistical Models
Assignments involving global food market analysis frequently present market shocks—such as natural disasters or policy interventions—and ask students to evaluate their effects on supply and demand. While you may not always be required to draw graphs, you must translate real-life events into analytical terms.
A typical starting point is constructing a theoretical supply and demand model. Statistically, this means considering:
- The direction of the change: Does a weather event reduce supply? If so, this results in a leftward shift of the supply curve.
- Elasticity of demand: When demand is inelastic, even a small supply shock can lead to large price increases.
For example, in a statistical description, you would mention that a reduction in supply, denoted by ΔS<0 leads to a change in equilibrium quantity Qe and price Pe, depending on the elasticity of demand Ed. You might use simple comparative statics to evaluate outcomes, focusing on qualitative descriptions over detailed calculations.
Discussing the Role of Inelastic Demand in Price Volatility
Assignments may prompt you to explore how different elasticities affect price movements. Statistically, demand elasticity Ed is defined as:
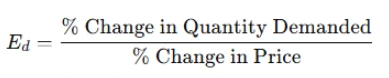
You are often not required to calculate this but to interpret its meaning. Inelastic demand (|Ed| < 1) indicates consumers don’t significantly reduce consumption when prices rise. In the context of food markets—especially in developing countries—this is critical. Statistical assignments here might require you to:
- Compare two demand curves (e.g., D1 and D2)
- Evaluate which scenario leads to greater price change
- Discuss how price responsiveness impacts food security
Using theoretical language to describe graphs and shifts—rather than complex algebra—is key to success in such assignments.
Analyzing Global Price Indices and Their Implications
Statistical assignments involving global food prices often require students to analyze price indices, such as the FAO Rice Price Index. These indices reflect average price trends over time and are vital for understanding market movements. Interpreting such data involves distinguishing between price levels and volatility, which has direct implications for global food access and affordability. Students must use time-series thinking and recognize the economic and social outcomes of price instability. Rather than calculating volatility, the focus should be on interpreting patterns, explaining causes, and assessing impacts on consumers and producers through theoretical and statistical lenses.
Distinguishing Between Price Levels and Price Volatility
Global food market statistics often involve analyzing price indices like the FAO Rice Price Index. Students are usually asked to distinguish between:
- High price levels: A sustained increase in the average market price.
- High price volatility: Rapid fluctuations in prices over time.
Statistical tasks here may involve identifying periods in a graph with steep price changes and interpreting what these mean for consumers and producers. Rather than performing volatility modeling (e.g., GARCH models), the focus is often on qualitative understanding:
- A price index reflects a time series of weighted average prices
- High volatility increases uncertainty in markets
- Statistical interpretation includes describing the range and frequency of price changes
Understanding the Impact of Price Changes on Different Economic Agents
Assignments frequently ask students to comment on who gains and who loses from food price changes. This requires more than economic intuition—it involves interpreting data within context:
- Producers in net-exporting countries may benefit from high prices
- Consumers in low-income countries suffer due to higher food bills
- Governments may respond with subsidies or trade policy measures
Students are often expected to connect these roles with statistical trends, such as rising or falling indices. You could enhance your response by using phrases like “the upward trend in the index corresponds with reduced affordability among vulnerable groups,” drawing on evidence from time-series patterns or historical crises.
Applying Trade Theory and Policy Evaluation to Food Markets
Assignments frequently include simplified models to explain how countries trade food products based on labor efficiency and opportunity costs. Students are expected to evaluate who benefits from trade, how resources are allocated, and how protectionist policies like tariffs alter domestic markets. Using basic trade theory, these assignments challenge you to link production data to trade patterns without complex formulas. Additionally, when trade policies are introduced, statistical welfare analysis—producer surplus, consumer surplus, and overall efficiency—is often tested. A sound response uses graphical intuition, comparative reasoning, and clear economic logic rooted in statistical understanding.
Evaluating Absolute and Comparative Advantage Through Labor Data
Some assignments present simplified labor productivity data and ask students to determine trade patterns using concepts like:
- Absolute advantage: Who produces more with fewer resources?
- Comparative advantage: Who has the lower opportunity cost?
Here, you are expected to interpret tabular data rather than perform advanced modeling. A solid theoretical response would involve:
- Identifying the country with the fewest labor units required
- Calculating opportunity cost through simple division
- Explaining trade flow predictions using statistical logic
This does not require elaborate equations—just a firm understanding of ratios and their implications in trade statistics.
Assessing the Effects of Trade Policy Using Welfare Analysis
Assignments may also include questions on the introduction of tariffs and their welfare implications. You might be given a graph or table and be asked to:
- Calculate changes in producer and consumer surplus
- Identify the shift in import levels
- Evaluate the overall welfare change
Even if you don’t perform numerical integration, you should describe:
- Consumer surplus decreases when prices rise
- Producer surplus increases due to less competition
- Government revenue increases from the tariff
- Total welfare likely decreases in small open economies
Your statistical interpretation should be narrative in nature, emphasizing economic reasoning supported by visual or numerical evidence.
Exploring Value Chains and Information Asymmetry in Food Systems
In many assignments, students are asked to evaluate how traditional and modern food systems operate in terms of efficiency, transparency, and equity. This involves understanding the structure of agricultural value chains, how value is added, and how information flows between actors. These tasks often include statistical descriptions of coordination mechanisms or production-consumption linkages. Another common aspect is analyzing the role of information asymmetry in distorting market behavior. Assignments in this area typically ask students to theorize about how labeling, standards, and certifications attempt to reduce market uncertainty while weighing their limitations through a statistical lens.
Understanding Traditional vs. Modern Value Chains
Some statistical assignments ask students to contrast traditional and modern food value chains. This involves evaluating qualitative and quantitative attributes such as:
- Number of actors
- Geographical reach
- Coordination mechanisms
- Data flow and transparency
You may be asked to describe the transformation of value chains following price shocks or crises. Statistically, this could include analyzing:
- Length of value chains: Number of intermediaries involved
- Distribution of value: Who gains how much at different stages
- Price transmission: How retail price changes affect farmers
Students should frame their answers using comparative analysis without complex data—just statistical reasoning based on structures and relationships.
Investigating the Statistical Implications of Information Asymmetry
Global food market assignments often delve into information asymmetry, where buyers and sellers have unequal information. This leads to:
- Market failure
- Reduced trust
- Regulatory interventions
Statistical analysis here involves understanding how labeling, standards, or certifications affect market outcomes. You might discuss how:
- Information asymmetry creates uncertainty
- Labeling regulations serve as statistical signals
- Standards help reduce information gaps, but may exclude small producers
Quantitative aspects might include reference to market shares or adoption rates of certified goods—but again, the response should remain theoretical, focusing on narrative explanation.
Conclusion
Global food market analysis assignments in statistics are intellectually stimulating and deeply relevant to real-world policy and development concerns. They challenge students to go beyond surface-level computation and embrace economic interpretation, comparative analysis, and theoretical reasoning.
Whether the assignment asks for supply shocks, trade theory applications, price index evaluation, or welfare impact analysis, the key lies in framing your answers around core statistical thinking. Use simple models to reflect real-world dynamics, describe graphical trends with precise language, and connect policy implications with measurable outcomes.
Rather than getting bogged down in complex math, focus on clarity, structure, and depth of explanation. Understand the relationships between variables, articulate how changes propagate through systems, and always tie back to the bigger picture—food security, international trade, and development.
By adopting this approach, students can confidently solve their statistics assignment on global food market analysis, offering not just accurate answers but meaningful insights rooted in statistical thought.