How to Overcome Common Problems in a Market Basket Analysis Assignment Using R

Claim Your Offer
Unlock a fantastic deal at www.statisticsassignmenthelp.com with our latest offer. Get an incredible 10% off on all statistics assignment, ensuring quality help at a cheap price. Our expert team is ready to assist you, making your academic journey smoother and more affordable. Don't miss out on this opportunity to enhance your skills and save on your studies. Take advantage of our offer now and secure top-notch help for your statistics assignments.
We Accept


- Understanding Market Basket Analysis
- Key Concepts in Market Basket Analysis
- Applications of Market Basket Analysis
- Preparing Data for Market Basket Analysis in R
- Loading and Formatting Transaction Data
- Handling Real-World Datasets
- Implementing the Apriori Algorithm in R
- Generating Frequent Itemsets
- Filtering and Sorting Rules
- Interpreting and Visualizing Association Rules
- Analyzing Rule Metrics
- Visualizing Rules with R
- Common Challenges and Solutions in Market Basket Analysis Assignments
- Dealing with Sparse Data
- Choosing Optimal Thresholds
- Conclusion
Market Basket Analysis (MBA) is a fundamental technique in data mining that helps businesses understand customer purchasing behavior by identifying patterns in products frequently bought together. This powerful method is extensively applied across retail, e-commerce, and marketing strategies to optimize product placements, design targeted promotions, and improve inventory management systems. For students tackling a Market Basket Analysis assignment in R, mastering this technique can seem daunting, but with the right approach, you can efficiently complete your R assignment while gaining valuable analytical skills. The process involves understanding key association rule mining concepts, properly preparing transactional datasets, implementing the Apriori algorithm, and interpreting the resulting patterns. This guide will walk you through each step while highlighting solutions to common challenges students face, ensuring you can confidently complete your R programming assignment with accurate, meaningful results. Whether you're analyzing supermarket transactions or e-commerce purchase histories, these practical insights will help you transform raw data into actionable business intelligence.
Understanding Market Basket Analysis

Market Basket Analysis is rooted in association rule mining, a method that detects relationships between variables in large datasets. The primary goal is to uncover associations between items that customers purchase together, allowing businesses to make data-driven decisions.
Key Concepts in Market Basket Analysis
- Itemset: A group of items that appear together in a transaction. For example, {Milk, Bread} is an itemset if customers frequently buy these two products together.
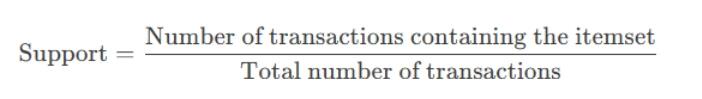
- Support: This measures how frequently an itemset appears in the dataset. It is calculated as:
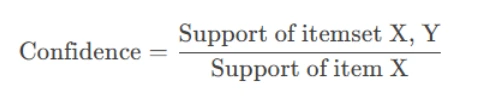
- Confidence: This represents the probability that item Y is purchased when item X is bought. It is calculated as:
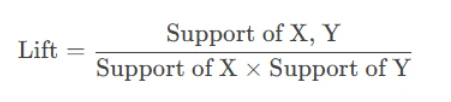
- Lift: This metric indicates how much more likely item Y is purchased when item X is bought, compared to its general purchase rate. It is calculated as:
A high support value indicates that the itemset is common.
A high confidence value suggests a strong association between the items.
A lift value greater than 1 implies a meaningful association.
Applications of Market Basket Analysis
- E-commerce: Recommending related products (e.g., "Frequently bought together").
- Healthcare: Identifying co-occurring symptoms or treatments.
- Web Analytics: Understanding user navigation patterns on websites.
- Banking and Finance: Detecting fraudulent transaction patterns.
Preparing Data for Market Basket Analysis in R
Before performing MBA, the dataset must be structured appropriately. Transactional data is typically stored in a binary matrix or a list format where each entry represents a set of items purchased together.
Loading and Formatting Transaction Data
The arules package in R is specifically designed for association rule mining. Here’s how to prepare your data:
# Install and load the necessary package
install.packages("arules")
library(arules)

# Sample transaction data
transactions <- list(
  c("Milk", "Bread", "Butter"),
  c("Milk", "Bread"),
  c("Bread", "Butter"),
  c("Milk", "Eggs")
)

# Convert the list into a transaction object
txn <- as(transactions, "transactions")

# Inspect the transactions
inspect(txn)
Handling Real-World Datasets
If your dataset is stored in a CSV file, follow these steps to convert it into a transaction format:
# Read the CSV file
data <- read.csv("transactions.csv")

# Convert to transaction format
txn_data <- as(data, "transactions")
Implementing the Apriori Algorithm in R
The Apriori algorithm is the most commonly used method for association rule mining. It works by identifying frequent itemsets and generating rules based on predefined support and confidence thresholds.
Generating Frequent Itemsets
The apriori() function in the arules package is used to find frequent itemsets:
# Run the Apriori algorithm
rules <- apriori(txn, parameter = list(support = 0.1, confidence = 0.5))

# Inspect the generated rules
inspect(rules)
Filtering and Sorting Rules
Not all generated rules are useful. To extract meaningful insights, filter the rules based on lift, confidence, or support:
# Filter rules with a lift greater than 2
strong_rules <- subset(rules, lift > 2)

# Sort rules by confidence in descending order
sorted_rules <- sort(strong_rules, by = "confidence", decreasing = TRUE)

# Inspect the sorted rules
inspect(sorted_rules)
Interpreting and Visualizing Association Rules
After generating the rules, the next step is to interpret and visualize them to derive actionable insights.
Analyzing Rule Metrics
- High Confidence: Indicates a strong relationship between items. For example, if the rule {Milk} → {Bread} has a confidence of 0.8, it means that 80% of customers who buy Milk also buy Bread.
- High Lift: Suggests that the association between items is not random. A lift value greater than 1 indicates a positive correlation.
- Support: Helps identify how frequently the rule applies in the dataset. Rules with low support may not be significant.
Visualizing Rules with R
The arulesViz package provides tools for visualizing association rules:
# Install and load the visualization package
install.packages("arulesViz")
library(arulesViz)

# Plot the rules as a graph
plot(rules, method = "graph", engine = "htmlwidget")
This visualization helps identify clusters of related items and highlights strong associations, making it easier to interpret complex rule sets.
Common Challenges and Solutions in Market Basket Analysis Assignments
Students often encounter difficulties when working on MBA assignments. Here are some common challenges and how to address them:
Dealing with Sparse Data
Sparse datasets, where most items appear infrequently, can lead to irrelevant rules. To mitigate this:
- Increase the minimum support threshold to focus on more frequent itemsets.
- Remove infrequent items from the dataset to reduce noise.
Choosing Optimal Thresholds
Selecting appropriate values for support, confidence, and lift is crucial:
- Start with a lower support value (e.g., 0.01) and adjust based on the number of rules generated.
- Use domain knowledge to set meaningful confidence levels. For example, in retail, a confidence threshold of 0.5 might be reasonable.
Conclusion
Market Basket Analysis stands as an indispensable tool for revealing valuable insights hidden within transactional data, offering students a practical framework to solve your statistics assignment while developing essential data mining skills. By harnessing the capabilities of R and the specialized arules package, learners can systematically perform MBA, transforming raw purchase data into actionable business intelligence. This comprehensive guide has walked you through the entire analytical process - from understanding fundamental concepts like support, confidence, and lift metrics, through proper data preparation techniques, to the practical implementation of the Apriori algorithm and meaningful interpretation of results. The skills acquired through this exercise not only help solve your statistics assignment effectively but also prepare you for real-world analytical challenges in retail, e-commerce, and beyond. As you continue to experiment with different datasets and threshold values, you'll further refine your ability to identify significant product associations and create compelling visualizations, building a strong foundation for advanced data analysis in your academic and professional journey.