Fitting and Plotting of Logistic Curve: A Comprehensive Guide for Statistics Assignments

Claim Your Offer
Unlock a fantastic deal at www.statisticsassignmenthelp.com with our latest offer. Get an incredible 10% off on all statistics assignment, ensuring quality help at a cheap price. Our expert team is ready to assist you, making your academic journey smoother and more affordable. Don't miss out on this opportunity to enhance your skills and save on your studies. Take advantage of our offer now and secure top-notch help for your statistics assignments.
We Accept


- Understanding the Logistic Curve in Statistics
- The Basics of Logistic Curves
- What is a Logistic Curve?
- Logistic Function Equation
- Fitting the Logistic Curve to Data
- Data Collection and Preparation
- Choosing the Right Model
- Non-linear Regression
- Plotting the Logistic Curve
- Using Graphing Tools
- Interpreting the Curve
- Addressing Assumptions and Limitations
- Conclusion
Statistics, as a cornerstone of scientific research, often delves into complex patterns within data. One such intricate yet vital aspect of statistical analysis is the fitting and plotting of logistic curves. In the dynamic landscape of data science, understanding the nuances of these curves is indispensable for students navigating the realm of statistics assignments. The logistic curve, characterized by its sigmoid shape, plays a pivotal role in modeling various real-world phenomena. From predicting population growth in biology to studying market saturation in economics, the applications are diverse and far-reaching. This comprehensive guide aims to demystify the process, breaking down the fundamental concepts into digestible fragments to complete your 2D Geometry Assignment. By delving into the mathematical intricacies, data preparation methods, and visualization techniques, this guide equips students with the knowledge necessary to tackle intricate statistics assignments with confidence and precision. With a deep understanding of how to fit and interpret logistic curves, students are empowered to unravel complex data patterns, enhancing their analytical skills and scientific acumen in the process.
Understanding the Logistic Curve in Statistics

The logistic curve stands as an indispensable tool in the arsenal of statisticians, offering a profound insight into the intricate dynamics of growth and saturation within diverse datasets. At its essence, this S-shaped curve embodies the essence of countless real-world phenomena, capturing the essence of gradual beginnings, accelerated expansion, and eventual stabilization. Its mathematical representation, often in the form of a logistic function, encapsulates the delicate balance between growth rate and carrying capacity, providing a nuanced understanding of how populations evolve. By grasping the fundamentals of logistic curves, students gain the ability to decipher the patterns underlying biological populations, market trends, and even the spread of diseases. This knowledge not only enhances their problem-solving skills but also nurtures a deep appreciation for the elegance and applicability of mathematical models in deciphering the complexities of our world.
The Basics of Logistic Curves
Understanding the fundamentals of logistic curves is paramount for any statistics student aiming to master data modeling techniques. At its core, a logistic curve embodies the essence of growth, saturation, and decline, encapsulating the dynamics of diverse real-world phenomena. The distinctive S-shaped curve of the logistic function elegantly captures scenarios where growth begins slowly, gains momentum, and eventually plateaus as it approaches a limiting value, known as the carrying capacity. This concept finds applications in numerous fields, ranging from epidemiology to ecology, providing invaluable insights into population dynamics. The logistic function's mathematical representation unveils the delicate balance between growth rate and environmental constraints, making it a pivotal tool for predicting trends and understanding the intricate patterns within datasets. Grasping these basics not only lays the foundation for more advanced statistical analyses but also empowers students to decipher the complexities of natural processes, fostering a deeper appreciation for the intricate harmony between mathematics and the world it describes.
What is a Logistic Curve?
At its core, a logistic curve is an S-shaped curve that represents the growth of a population over time. It is widely used in various fields such as biology, economics, and epidemiology to model growth, saturation, and decline processes. The curve starts slowly, accelerates its growth, and then levels off as it approaches an upper limit. This upper limit is a crucial parameter known as the carrying capacity.
Logistic Function Equation
The logistic curve is mathematically represented by the logistic function, which has the following form:
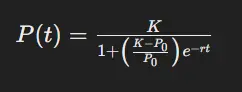
Where:
- P(t) is the population at time t
- P0 is the initial population size
- K is the carrying capacity, the maximum population size that the environment can sustain
- r is the growth rate parameter
- e is the base of the natural logarithm
Fitting the Logistic Curve to Data
Fitting a logistic curve to empirical data marks a pivotal stage in statistical analysis, demanding meticulous attention to detail and a profound understanding of the underlying processes. This phase commences with the careful collection and organization of relevant data, ensuring its accuracy and appropriateness for the chosen model. The selection of the logistic curve as a model is of paramount importance, especially when dealing with phenomena exhibiting gradual growth, acceleration, and eventual stabilization. Employing non-linear regression techniques becomes imperative, as they enable the estimation of the curve's parameters, such as the initial population size and the growth rate, thereby aligning the model with the empirical data points. This meticulous process necessitates a judicious choice of statistical software and algorithms, emphasizing the need for students to grasp the intricacies of these computational tools. Through this precise fitting, students not only refine their mathematical skills but also gain a profound insight into the art of transforming raw data into meaningful, predictive models, thereby honing their ability to make informed decisions based on real-world observations.
Data Collection and Preparation
Before fitting a logistic curve, you need quality data. Ensure your data is accurate, relevant, and free from errors. Once you have your data, organize it into a table with time and corresponding population values.
Choosing the Right Model
In statistics, selecting an appropriate model is vital. A logistic curve is suitable when you anticipate growth that starts slow, accelerates, and then levels off. Other models like linear or exponential might not capture this pattern accurately.
Non-linear Regression
Fitting a logistic curve involves non-linear regression. Unlike linear regression, where the relationship between variables is linear, here, you're estimating the parameters of a curve. This process requires specialized algorithms, often implemented in statistical software like Python’s SciPy library or R.
Plotting the Logistic Curve
Plotting the logistic curve is an art that bridges the gap between raw data and meaningful insights. With the data accurately fitted to the logistic function, visualization becomes the key to unraveling the story hidden within the numbers. Graphing tools like Matplotlib in Python or ggplot2 in R serve as virtual canvases where the dynamics of growth, saturation, and equilibrium come to life. The plotted curve, with time delineating the x-axis and population size adorning the y-axis, offers a visual narrative of the phenomena under study. Beyond its aesthetic appeal, the curve's trajectory tells a tale of initial slow progress, followed by rapid expansion, and eventual stabilization. This visual representation not only validates the mathematical model but also provides a tangible grasp of the underlying patterns, making it an indispensable tool for students deciphering the complexities of statistics assignments. Interpreting the nuances of the plotted logistic curve elevates statistical analyses, enabling students to articulate precise conclusions and make data-driven decisions, thus enhancing their analytical prowess and confidence in the realm of statistics.
Using Graphing Tools
After fitting the logistic curve to your data, visualizing it is crucial. Graphing tools like Matplotlib in Python or ggplot2 in R make this task easier. Plot time on the x-axis and population on the y-axis. Your curve should start slowly, rise steeply, and then plateau as it approaches the carrying capacity.
Interpreting the Curve
Understanding the plotted curve is as important as plotting it. Analyze the curve's behavior. Is the population growing as expected? Has it reached the carrying capacity? Interpreting these aspects correctly is crucial for drawing meaningful conclusions from your data.
Addressing Assumptions and Limitations
Every statistical model has assumptions and limitations. Acknowledge these in your analysis. Is the data stationary? Are there outliers? Addressing these issues enhances the accuracy and reliability of your results.
Conclusion
In the realm of statistics, mastering the art of fitting and plotting a logistic curve is indispensable. This skill empowers students to analyze and interpret real-world phenomena accurately. By understanding the underlying mathematics, data preparation, model selection, and visualization techniques, students can tackle complex statistics assignments with confidence. Remember, practice and a deep understanding of the logistic curve's intricacies will pave the way for success in the fascinating world of statistical analysis.
You Might Also Like
Explore a wealth of knowledge and insights through our engaging blogs. From expert tips and industry trends to practical advice and innovative solutions, our blog is your go-to resource for staying informed and inspired. Dive into our latest posts and unlock new perspectives on topics that matter to you.