Understanding the Fitting of Normal Distributions: A Comprehensive Guide for Students

- Understanding the Normal Distribution
- Practical Tips for Students
- Conclusion
Claim Your Offer
Unlock a fantastic deal at www.statisticsassignmenthelp.com with our latest offer. Get an incredible 10% off on all statistics assignment, ensuring quality help at a cheap price. Our expert team is ready to assist you, making your academic journey smoother and more affordable. Don't miss out on this opportunity to enhance your skills and save on your studies. Take advantage of our offer now and secure top-notch help for your statistics assignments.
We Accept


Statistics, the science of collecting, analyzing, and interpreting data, underpins countless disciplines and industries, making it an essential skill for students. At the heart of statistical analysis lies the normal distribution, often referred to as the Gaussian distribution. This foundational concept provides a framework for understanding how data tends to cluster around a central value, with a predictable spread. Mastering the fitting of normal distributions is paramount for students, as it unlocks a powerful analytical toolset. It allows them to model real-world phenomena accurately, from the heights of a population to the scores in an exam. Through this comprehensive guide, we aim to demystify the process, equipping students with the expertise needed to excel in their statistical assignments. As you delve deeper into this guide, you'll gain a profound appreciation for the elegance and utility of the normal distribution. Beyond mere equations and formulas, you'll discover how this concept transcends academia, finding applications in fields as diverse as finance, biology, and quality control. Armed with this knowledge, students will not only solve assignments but also gain a deeper understanding of the world's intrinsic statistical nature.

Understanding the Normal Distribution
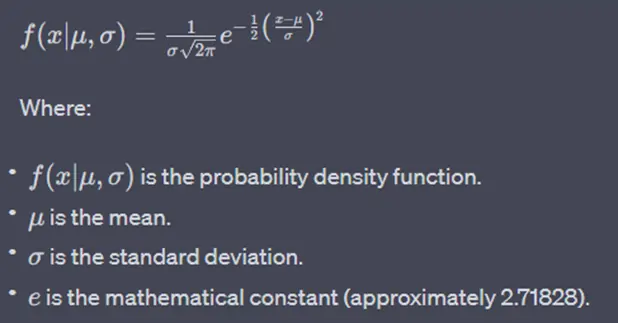
The normal distribution is a symmetric, bell-shaped curve that is completely defined by its mean (μ) and standard deviation (σ). These parameters dictate the center and the spread of the distribution, respectively. The probability density function (PDF) of a normal distribution is given by the famous bell-shaped curve formula:
- Data Collection and Description
- Visual Inspection
- Parameter Estimation
- Goodness of Fit Tests
- Visualization and Interpretation
Collecting and describing data is the foundational pillar upon which the fitting of a normal distribution rests. This initial step is akin to setting the stage for a statistical performance. When students embark on this journey, they take on the role of data detectives, unraveling the story that numbers have to tell.
Calculating the mean (μ) and standard deviation (σ) is the first order of business. The mean is the arithmetic average, representing the central tendency of the data. It's the point around which data clusters, much like the nucleus of an atom. Meanwhile, the standard deviation measures the dispersion or spread of the data points from this nucleus. Together, they define the heart and soul of the normal distribution.
But the data's story doesn't end there. Descriptive statistics like skewness and kurtosis add depth to the narrative. Skewness reveals whether the data is asymmetrical, with a tendency to lean towards one side. Kurtosis, on the other hand, unveils the data's propensity for extreme values or outliers. It's like analyzing the plot twists and character development in a novel.
In assignments, this step is where students establish the data's identity and personality. Is it a gentle, symmetric distribution, or a complex, asymmetrical one? By grasping these fundamental aspects, students embark on a journey towards understanding the intricacies of data, a journey that ultimately leads to fitting the data into a normal distribution, like placing pieces into a well-defined puzzle.
Prior to embarking on the fitting process of a normal distribution, a critical preliminary step is the visual inspection of the dataset. While numbers and statistical metrics provide valuable insights, there is a profound dimension to data that can only be uncovered through visualization.
Creating a histogram, a frequency distribution of data, allows you to see the shape and pattern of your data. When data follows a normal distribution, the histogram typically displays a characteristic bell-shaped curve, where values cluster around the mean. Deviations from this bell-shaped pattern may raise red flags. If the histogram reveals skewness (asymmetry) or unusual peaks, it's a clear indication that the data may not conform to a normal distribution.
Probability plots, such as the quantile-quantile (Q-Q) plot, offer another lens through which to examine data distribution. These plots compare the quantiles of your dataset against the expected quantiles of a normal distribution. A close alignment indicates adherence to normality, while deviations signal non-normal behavior.
Recognizing such deviations is crucial because they can inform subsequent steps. Data that diverges from normality may require transformations, like logarithmic or Box-Cox, to make it more amenable to a normal distribution fit. Alternatively, it might indicate that a different distribution altogether is a better fit for the data, emphasizing the importance of this visual assessment in the process of fitting distributions accurately.
After deciding to proceed with fitting a normal distribution, the focus shifts to the critical task of parameter estimation. This step involves determining the values of the two fundamental parameters: μ (the mean) and σ (the standard deviation), which entirely define the normal distribution.
There are several methods to estimate these parameters, with two primary approaches being the method of moments and maximum likelihood estimation (MLE).
The method of moments involves equating sample moments (e.g., the sample mean and sample variance) to their theoretical counterparts for a normal distribution. This method provides straightforward estimations, but it may not always yield the most efficient estimates, especially for small sample sizes.
On the other hand, maximum likelihood estimation (MLE) is a highly regarded technique in statistics. MLE aims to find the parameter values that maximize the likelihood of observing the given data under the assumed normal distribution. It's an optimization process that leverages the data's probability distribution to derive the most probable parameter values.
MLE is preferred for its statistical efficiency and robustness, particularly with larger datasets. It's widely used in various fields and is often the method of choice when fitting normal distributions, as it provides estimates that are most likely to be accurate representations of the underlying population.
Once you've successfully fitted a normal distribution to your data, the journey is far from over. The next critical phase is to rigorously evaluate the quality of the fit. This assessment is essential to ascertain the appropriateness of using the normal distribution as a model for your data.
The goodness of fit tests comes to the rescue here. These statistical tests, like the Kolmogorov-Smirnov test and the Anderson-Darling test, play a pivotal role in objectively measuring the agreement between your observed data and the fitted normal distribution.
The Kolmogorov-Smirnov test quantifies the maximum difference between the cumulative distribution function of your data and the theoretical normal distribution. The Anderson-Darling test, on the other hand, is more sensitive to deviations in the tails of the distribution.
These tests provide p-values, which indicate the level of agreement between your data and the assumed normal distribution. A low p-value suggests a significant deviation, signaling that the data may not fit a normal distribution well.
Visualization plays a pivotal role in the evaluation of the fit of a normal distribution. It provides a tangible and intuitive means to comprehend the relationship between your data and the modeled distribution.
Overlaying the fitted normal distribution on a histogram of the data offers a straightforward visual comparison. This juxtaposition allows you to gauge how well the bell-shaped curve aligns with the observed data's frequency distribution. If the fit is accurate, you'll observe a close correspondence between the histogram bars and the curve, validating the choice of the normal distribution.
Quantile-quantile (Q-Q) plots offer another potent tool. These plots provide a visual representation of how closely the quantiles (ordered values) of your dataset match the expected quantiles of a normal distribution. A perfectly fitted normal distribution will result in a straight diagonal line on the Q-Q plot. Deviations from this line can reveal where the fit is lacking, indicating potential issues in modeling the data as a normal distribution.
Navigating the fitting of a normal distribution can be a straightforward process when data aligns neatly with the bell-shaped curve. However, real-world data often presents challenges that demand creative solutions.
- Skewed Data:
- Outliers:
- Sample Size Considerations:
Skewness, the asymmetry of data distribution, is a common issue. When dealing with positively skewed data (where the tail extends to the right), consider applying logarithmic or Box-Cox transformations. These transformations compress the high values, making the data more symmetric and potentially improving the fit to a normal distribution. For negatively skewed data (where the tail extends to the left), the reverse transformation may be useful.
Outliers, extreme values that deviate significantly from the bulk of the data, can heavily impact normal distribution fitting. These data points can stretch the distribution's tail or shift the mean, leading to an inaccurate fit. Robust statistical methods offer solutions. One approach is to identify and remove outliers before fitting the normal distribution. Alternatively, you can use robust estimators for the mean and standard deviation (e.g., the median and median absolute deviation) that are less sensitive to outliers.
Small sample sizes can pose challenges when attempting to fit a normal distribution. With limited data points, estimating parameters like the mean and standard deviation may be imprecise. In such cases, it's essential to consider alternative distribution models that might better suit the data's characteristics. Non-parametric methods, such as the Kolmogorov-Smirnov test or the Shapiro-Wilk test, can also be valuable. These tests assess normality without assuming a specific distribution, making them suitable for smaller samples.
Practical Tips for Students
- Utilize Statistical Software:
- Understand the Assumptions:
- Interpret Results:
- Practice with Real Data:
Employing statistical software can significantly streamline your work. Popular programming languages like R and Python offer libraries such as NumPy, SciPy, or Statsmodels that provide pre-built functions for fitting normal distributions and conducting goodness of fit tests. Software like Excel also has built-in statistical functions that can be used for these purposes. Leveraging such tools saves time and ensures accuracy in your analysis.
It's essential to grasp the underlying assumptions when fitting a normal distribution. The normality assumption is pivotal. Remember that the normal distribution is appropriate when your data is approximately normally distributed. If this assumption is violated, consider alternative approaches like non-parametric methods or exploring other distribution models that better suit your data.
Fitting a normal distribution isn't merely a technical exercise; it's about deriving meaningful insights from data. When completing assignments, go beyond the mechanics of fitting and delve into the interpretation of your results. Discuss the implications of choosing a normal distribution and critically assess the reliability of the fit. Are there potential outliers or skewness that might affect your conclusions? Addressing these questions demonstrates a deeper understanding of the statistical process.
Practical experience is invaluable. Engage with real-world datasets to gain a hands-on understanding of fitting normal distributions. Real data often presents challenges that aren't encountered in textbook examples, such as dealing with missing values, outliers, or complex data structures. By working with diverse datasets, you'll develop problem-solving skills and learn how to adapt fitting techniques to different scenarios.
Conclusion
In conclusion, mastering the fitting of normal distributions is a valuable skill for students navigating statistical assignments. Understanding the nuances of the normal distribution, the fitting process, and addressing common challenges empowers students to apply statistical concepts in a meaningful way. Remember, statistics is not just about numbers; it's about deriving meaningful insights from data, and fitting normal distributions is a crucial step in that journey. As you embark on assignments, armed with this knowledge, may you navigate the world of distributions with confidence and precision.