A Detailed Approach to Solving Statistical Problems with Linear Regression Models
Claim Your Offer
Unlock a fantastic deal at www.statisticsassignmenthelp.com with our latest offer. Get an incredible 10% off on all statistics assignment, ensuring quality help at a cheap price. Our expert team is ready to assist you, making your academic journey smoother and more affordable. Don't miss out on this opportunity to enhance your skills and save on your studies. Take advantage of our offer now and secure top-notch help for your statistics assignments.
We Accept


- Understanding the Linear Regression Model
- What is a Linear Regression Model?
- What Role Does the Error Term Play?
- Interpreting the Variables and Regression Equation
- Factors in the Error Term
- Correlation Between Error Term and Education
- Conditions for a Valid Linear Regression Model
- Assumptions of the Model
- Identifying the Correct Model
- Regression Interpretation and Analysis
- Interpreting the Coefficients
- Understanding Significance and Fit
- Application to Other Types of Assignments
- Case Study: Linear Consumption Function
- Predicting Values Using the Model
- Visualizing the Regression
- Conclusion
Statistical assignments that involve analyzing relationships between variables are a common challenge for students, especially those working with linear regression models. In this blog, we will provide a comprehensive, theoretical approach to solving assignments like the one attached. The concepts and techniques shared here are not only valuable for understanding the specific problem at hand but also applicable to a variety of similar statistical assignments. By the end of this guide, you'll have a clear understanding of how to solve your linear regression assignment with ease. We will focus on the core concepts of linear regression models, which are essential tools for analyzing and interpreting relationships between variables such as education, fertility, income, and consumption. This blog aims to equip you with the knowledge needed to approach these types of assignments effectively, allowing you to apply the techniques to your own work confidently.
Understanding the Linear Regression Model
A linear regression model is one of the fundamental tools in statistics for modeling relationships between variables. It is widely used in assignments involving correlation and causality. In this section, we explain the purpose of a linear regression model, its components, and how it helps estimate relationships between dependent and independent variables. Understanding the equation's structure sets the foundation for solving any statistical assignment that involves prediction or explanation.

What is a Linear Regression Model?
At its core, a linear regression model attempts to explain the relationship between a dependent variable and one or more independent variables. In many statistical assignments, you'll encounter simple or multiple linear regression equations. These models help you predict or estimate the value of a dependent variable based on the values of independent variables.
A simple example of a linear regression model is:
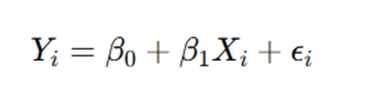
Where:
- Yi is the dependent variable,
- Xi is the independent variable,
- β0 is the intercept,
- β1 is the slope of the line,
- ϵi is the error term.
What Role Does the Error Term Play?
The error term (ϵi) represents unobserved factors that influence the dependent variable but are not captured by the independent variable in the model. This error term accounts for randomness or unknown influences, such as individual-specific characteristics or external factors that may affect the dependent variable.
In the assignment, the equation kidsi=β0+β1educi+ϵi links the number of children ever born (kidsi) to the years of education (educi) for a woman. The error term captures all unobserved factors that could influence fertility, like personal health, cultural factors, or socioeconomic status.
Interpreting the Variables and Regression Equation
Interpreting regression coefficients and the relationship between variables is crucial for drawing meaningful conclusions. In this section, we discuss how to understand the impact of the independent variable(s) on the dependent variable, using examples from the attached assignment. Understanding the signs and magnitudes of coefficients allows you to analyze and interpret the results effectively.
Factors in the Error Term
In this context, the error term ϵi\epsilon_iϵi could include many factors that are unobserved and likely related to education. These could include:
- Health conditions that affect fertility,
- Socioeconomic background,
- Cultural norms and values regarding family size.
Since these factors may vary across individuals and are difficult to measure directly, they are included in the error term.
Correlation Between Error Term and Education
The important question is whether the error term is correlated with the independent variable, educi. If there is a correlation between ϵi and educi , the estimates for β0 and β1 could be biased. For example, if women with higher education levels are more likely to have access to healthcare, this could affect fertility but not be captured by the education variable alone. In this case, the model would not uncover a true causal relationship between education and fertility.
Conditions for a Valid Linear Regression Model
To draw valid conclusions, the linear regression model must meet certain assumptions. In this section, we emphasize the importance of these assumptions for obtaining unbiased estimates. We also explain when the regression model will uncover true relationships between variables, and the potential pitfalls if assumptions are violated.
Assumptions of the Model
To ensure that the regression model provides valid and unbiased estimates, certain assumptions need to be met. One key assumption is that the error term is not correlated with the independent variable. This condition is crucial for the regression to uncover the "partial effect" of education on fertility. The "partial effect" refers to the effect of education on fertility while holding other factors constant.
In statistical terms, this means:
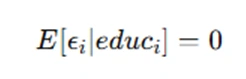
If this assumption holds true, then the regression coefficients can be interpreted as the true effect of education on fertility.
Identifying the Correct Model
The model you use to estimate relationships must match the nature of the data. In the assignment, the simple linear regression model is appropriate for analyzing the relationship between education and fertility. If there were multiple factors affecting fertility, such as income, health, or family structure, a more complex model (like multiple regression) could be necessary.
Regression Interpretation and Analysis
Once you've estimated the regression model, you need to interpret the results and check the model fit. This section covers how to interpret the regression coefficients, evaluate statistical significance, and assess the model’s performance. By understanding these aspects, you can confidently analyze your data and make informed conclusions.
Interpreting the Coefficients
Once you have estimated the regression model, you need to interpret the coefficients. In the example, β0 represents the intercept, which is the predicted number of children when education is zero. β1 represents the slope, which indicates how much the number of children changes with each additional year of education.
For instance, if β1=−0.3 it suggests that for each additional year of education, the number of children ever born to a woman is expected to decrease by 0.3, all else being equal.
Understanding Significance and Fit
After estimating the model, it's important to check the statistical significance of the coefficients. This involves examining p-values and confidence intervals to determine whether the coefficients are significantly different from zero. A high R-squared value (closer to 1) indicates that the model explains a significant portion of the variation in the dependent variable.
In some cases, you may also need to visualize the relationship by plotting the regression line. A scatter plot with a regression line can help you assess whether the relationship is linear and if the model fits the data well.
Application to Other Types of Assignments
This section focuses on how the principles discussed in the previous sections can be applied to solve other types of statistical assignments, like those involving linear consumption functions or pension plans. We explain how to approach these assignments systematically, using similar steps and considerations.
Case Study: Linear Consumption Function
In another part of the assignment, you are asked to analyze a linear consumption function. The equation:
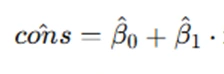
income is used to study the relationship between consumption (cons) and income (income). Interpreting the intercept and slope helps in understanding how income affects consumption, while the R-squared value tells you how well the model fits the data.
Predicting Values Using the Model
Once you have your regression coefficients, you can predict the value of the dependent variable for given values of the independent variable. For example, if the income is $30,000, you would substitute this value into the regression equation to predict the consumption.
Visualizing the Regression
A graph of the sample regression function can help you visualize the relationship between income and consumption. Plotting the data points along with the regression line helps you see whether the relationship is linear and whether the data is well-fitted by the model.
Conclusion
In conclusion, solving statistical assignments that involve linear regression models requires a solid understanding of the variables, their interrelationships, and the assumptions that form the foundation of the model. It is essential to carefully interpret the regression coefficients, ensuring that you accurately assess the direction and strength of the relationships between the variables. Additionally, checking the fit of the model, whether through visualizations or statistical tests, allows you to gauge how well the model explains the data. Whether you're examining the impact of education on fertility, income on consumption, or exploring any other set of relationships, the ability to apply theoretical knowledge effectively to practical problems is crucial. This theoretical grounding is the key to deriving meaningful conclusions from your statistical analysis. By following the structured approach outlined in this blog, you can confidently approach and solve any similar assignment, ensuring that you complete your statistics assignment with accuracy and gain deeper insights into the data.