Analyzing COVID-19 Infection Rates in New York: Statistical Insights and Policy Evaluation Using Stata

- Problem Description
- Skills Utilized:
- Question 1
In the midst of the COVID-19 pandemic, understanding infection rates and the effectiveness of policy responses is paramount. This analysis delves into New York's COVID-19 landscape, employing statistical techniques and Stata software. We explore the statistical characteristics of infection rates in New York City, Brooklyn, and Manhattan, and examine the impact of policy responses. Through descriptive statistics, confidence intervals, hypothesis testing, and effect size measurements, we draw meaningful conclusions about the efficacy of these policies. This study sheds light on the critical issue of public health and guides future decision-making in combating the pandemic.
Problem Description
In a statistical analysis assignment using stata, we analyze COVID-19 infection rates in New York, specifically in New York City and its boroughs, Brooklyn and Manhattan. We aim to understand the statistical characteristics of these infection rates, compare them, and evaluate the effectiveness of policy responses in reducing infection rates.
Skills Utilized:
- Statistics of COVID Cases by Area: We explore and analyze COVID-19 infection rates using statistical methods.
- Stata: Stata, a data analysis and statistical software, is employed to perform the analysis.
Question 1
a) Summary Statistics
| Count | Mean | Std. Dev. | Min | Max | Variance | Skewness | Kurtosis |
|---|---|---|---|---|---|---|---|
| 121 | 11.3287 | 3.0017 | 4.6543 | 22.4900 | 9.0104 | 0.3410 | 3.8088 |
- Table 1: Summary Statistics
From the inferential statistic table, the COVID-19 infection rate for New York (N=121; M=11.3287; SD=3.0017) is left-skewed with a leptokurtic shape. This suggests that the infection rate is not within the range of normality, indicating a non-normal distribution.
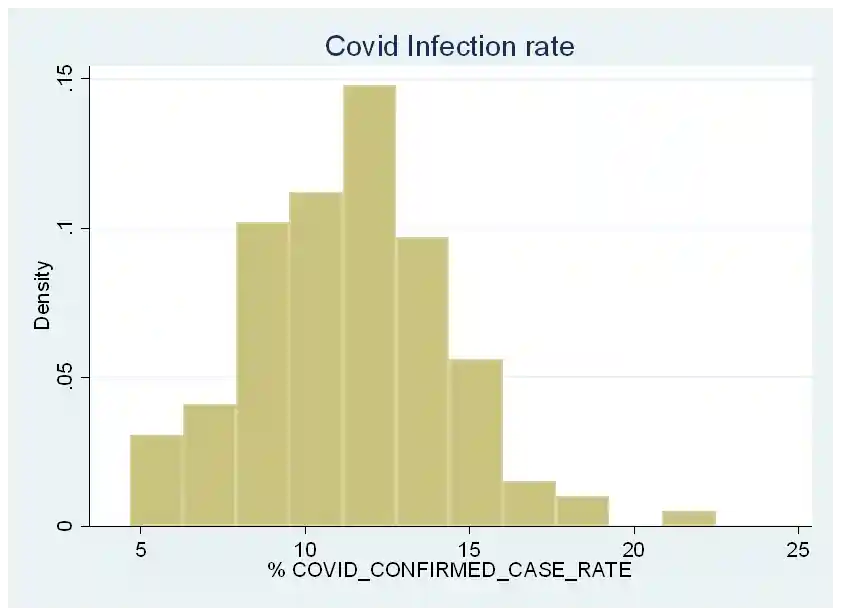
Figure 1: Histogram Plot of COVID-19 Infection Rates in New York City
The histogram plot visually confirms that the infection rates are non-normally distributed, skewed to the left.
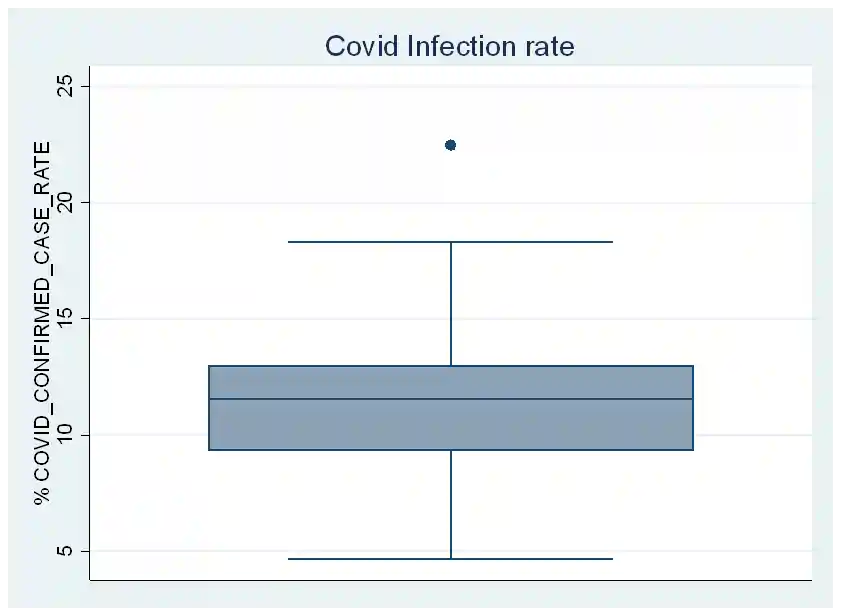
The boxplot reveals that the daily infection rate is relatively consistent, indicating no outliers.
b) Research Question
Research Question: To what extent have the policies employed in NYC decreased the COVID-19 infection rate compared to other states?
Null Hypothesis: Policy responses to COVID-19 in NY are more successful than those carried out in other states.
Alternative Hypothesis: Policy responses to COVID-19 in NY are not more successful than those carried out in other states.
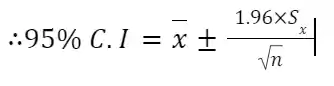
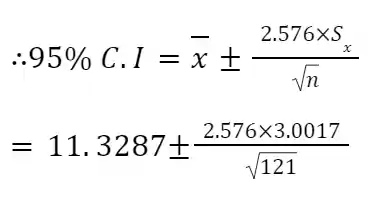
c) For a confidence interval of 95%
- Confidence Interval (CI):
- n=121
- x̅=11.3287
- S_x=3.0017
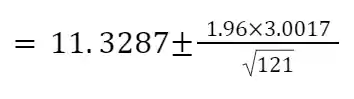
=11.3287±0.534854
=10.7938,11.8635
The hypothesized mean value is not within this range, making it implausible as a population parameter.
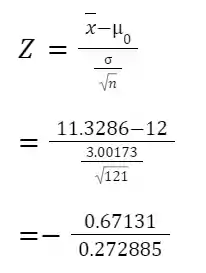
- Test Score:
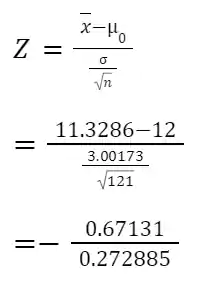
=-2.46005
Ztab=1.96
Conclusion: A one-sample z-test suggests a significant difference in the mean infection rate of COVID-19 in New York City compared to the hypothesized mean infection rate in all states (p = 0.01389). These results indicate that the policy responses in NY are not more successful than those in other states.
P-value:
- p-value = P(T < Z_cal)
- (p-value = 0.0069)
Conclusion: The p-value (0.0069) is less than the significance level (0.05), indicating insufficient evidence to accept the null hypothesis. Thus, policy responses in NY are not more successful than those in other states.
d) Objective
The objective is to explore the impact of policy responses in New York City on decreasing COVID-19 infection rates. Descriptive statistics, the confidence interval, and hypothesis testing reveal that response policies do not significantly reduce COVID-19 infection rates in New York City at a 0.05 significance level.
Question 2
For a confidence interval of 99%, a similar analysis is conducted. The results suggest that there is no significant difference in COVID-19 infection rates between New York City and other states.
One-sample z test
| Variable | Obs | Mean | Std. Err. | Std. Dev. | [99\ Conf. Interval) | |
|---|---|---|---|---|---|---|
| c-e rate | 121 | 11.32869 | .2728845 | 3.00173 | 10.62578 | 12.03159 |
mean Ho: mean mean(Covid_confirmed_case_rate) 12z = -2.4601
- Table 3: Stata Output
Confidence Interval
n=121
x ̅=11.3287
Sx=3.0017
=11.3287±0.702951
=10.62574,12.03164
Test Score
=-2.46005
Ztab=2.
Effect Size
The Cohen's d test is conducted to measure the effect size, resulting in a value of 1.38467.
Objective
The exercise aims to explore the difference in COVID-19 infection rates between Manhattan and New York City. The results indicate a statistically significant difference at a 0.05 significance level.
Question 3
a) Analysis for Brooklyn and Manhattan
For Brooklyn (N=37; M=10.77; SD=2.29), the infection rate is almost normally distributed but with a leptokurtic shape. For Manhattan (N=44; M=8.12; SD=1.52), the infection rate is negatively skewed with a leptokurtic shape.
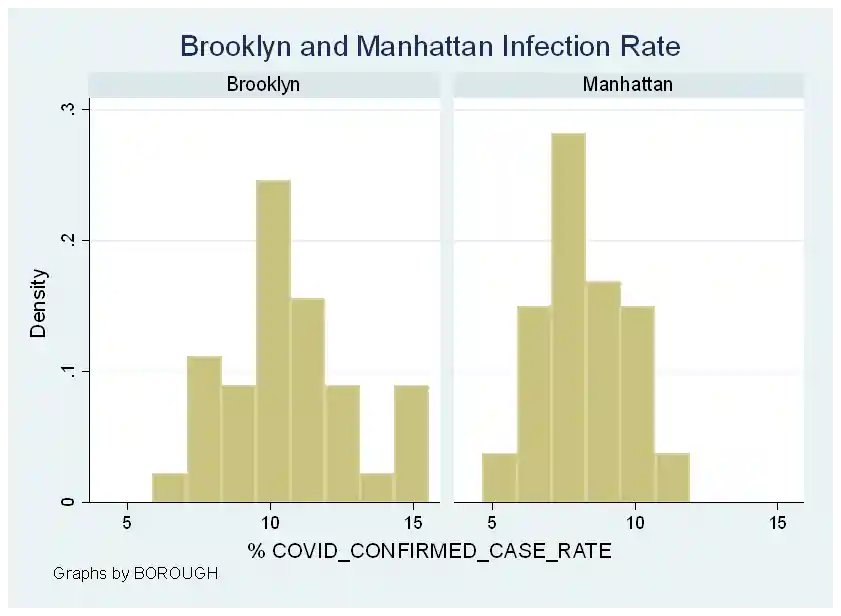
- Figure 3: Histogram plot showing COVID-19 infection rates for Brooklyn and Manhattan
The histogram plot visually shows the infection rates for Brooklyn are right-skewed, while Manhattan's rates are centered around the mean.
b) Research Question
Research Question: Is there a significant difference in the COVID-19 infection rates in Brooklyn and Manhattan?
Null Hypothesis: There is no significant difference between COVID-19 infection rates in Brooklyn and Manhattan.
Alternative Hypothesis: There is a significant difference between COVID-19 infection rates in Brooklyn and Manhattan.
c) Stata Output
| Two-sample | z test | |||||
|---|---|---|---|---|---|---|
| Group | Obs | Mean | Std. Err . | Std. Dev . | (90\ Conf. | Interval) |
| Brooklyn | 37 | 10.77113 | .3770137 | 2.293285 | 10.151 | 11.39127 |
| Manhatta | 44 | 8.122015 | .2296947 | 1.523622 | 7.744201 | 8.49983 |
| diff | 2.649119 | .4414737 | 1.92296 | 3.375279 | ||
diff Ho: diff rnean(Brooklyn) - mean(Manhatta) 0 z 6.0006
Table 4: Two-sample z-test with 90% confidence level
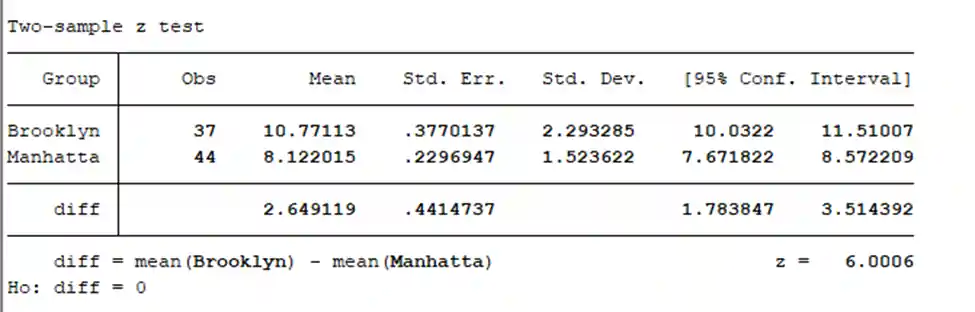
Table 5: Two sample z-test with 95% confidence level
At 95% confidence level:
n_1=37
n_2=44
x ̅_1=10.7711
x ̅_2=8.12202
S_1=2.29328
S_2=1.52362
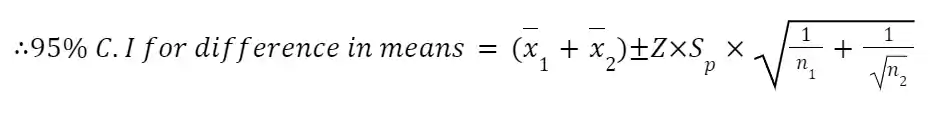
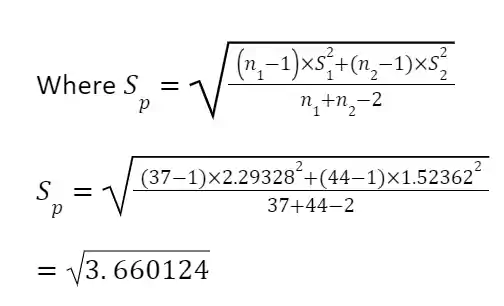
=1.913145
x1+x2=10.7711-8.12202
=2.64908
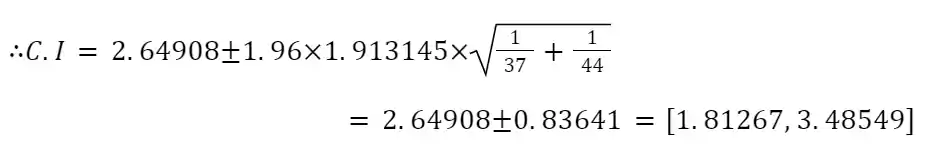
i) Confidence Interval: [1.81267, 3.48549] ii) Test Score: Z_α = 6.0006 (p = 0.0000) iii) P-value: (p-value = 0.0000)
Conclusion: The results suggest a statistically significant difference between the infection rates in Brooklyn and Manhattan.
d) Effect Size
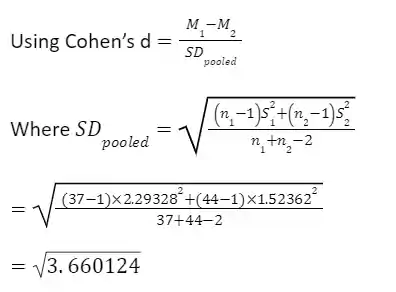
=1.913145
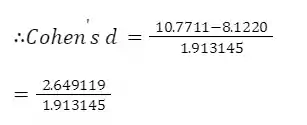
=1.38467
Cohen's d = 1.38467
e) Objective
The analysis aims to determine the difference in COVID-19 infection rates between Manhattan and Brooklyn. The results reveal a statistically significant difference at a 0.05 significance level.
In conclusion, the assignment involved analyzing COVID-19 infection rates in New York City and its boroughs, comparing the effectiveness of policy responses, and conducting hypothesis tests to draw meaningful conclusions about the data. The results have practical implications for public health and policy decisions regarding the ongoing pandemic.
You Might Also Like
Explore our diverse sample collection for insightful assignments covering fundamental concepts to advanced methodologies. Dive into a wealth of topics and solutions tailored to your needs. Unlock valuable knowledge and inspiration through our curated samples.
STATA
Statistical Analysis
Statistical Analysis
Statistical Analysis
Statistical Analysis
Statistical Analysis
Statistical Analysis
Statistical Analysis
Statistical Analysis
STATA
Statistical Analysis
Statistics
Statistical Analysis
Statistical Analysis
SAS
R Programming
Statistical Analysis
Statistical Analysis
STATA
Statistics