How to Analyze Orthogonal Contrasts of Means in ANOVA Assignments

Claim Your Offer
Unlock a fantastic deal at www.statisticsassignmenthelp.com with our latest offer. Get an incredible 10% off on all statistics assignment, ensuring quality help at a cheap price. Our expert team is ready to assist you, making your academic journey smoother and more affordable. Don't miss out on this opportunity to enhance your skills and save on your studies. Take advantage of our offer now and secure top-notch help for your statistics assignments.
We Accept


- Understanding Orthogonal Contrasts of Means in ANOVA
- What Makes a Contrast Orthogonal?
- Why Orthogonality Matters in ANOVA
- Constructing and Interpreting Orthogonal Contrasts
- Steps to Construct Orthogonal Contrasts
- Interpreting Results of Orthogonal Contrasts
- Applications of Orthogonal Contrasts in Statistical Analysis
- Testing Hypotheses Beyond the Overall F-test
- Building Confidence Intervals for Contrasts
- Advanced Considerations in Orthogonal Contrasts
- Partial F-tests and Partitioning Variance
- Common Challenges in Constructing Orthogonal Contrasts
- Practical Examples of Orthogonal Contrasts in ANOVA
- Example 1: Comparing Treatments to a Control
- Example 2: Educational Intervention Study
- Conclusion
Analysis of variance (ANOVA) is one of the most powerful tools in statistics for comparing means across multiple groups. Beyond the standard F-test that determines whether there are significant differences among group means, there are additional methods that help refine our understanding of where those differences occur. One of the most insightful approaches is the use of orthogonal contrasts of means.
Contrasts allow researchers and students to test specific hypotheses about the relationships between group means, rather than only asking if all groups differ in general. Orthogonal contrasts, in particular, provide a mathematically elegant and statistically efficient way to partition variance into independent components. This makes them highly valuable in both theoretical and applied research settings, especially in ANOVA assignments where careful interpretation of group comparisons is required. Gaining a clear understanding of orthogonal contrasts can significantly help when you need to solve your ANOVA assignment effectively.
In this blog, we will explore orthogonal contrasts in detail—what they are, how they work, how they can be applied in ANOVA, and why they are so essential for deeper statistical analysis. Understanding these concepts can also make it easier to do your statistics assignment.

Understanding Orthogonal Contrasts of Means in ANOVA
When dealing with multiple group means in ANOVA, the overall F-test only tells us that at least two means differ. However, it does not indicate which groups are different. This is where contrasts come into play. Contrasts are specific comparisons among group means that are defined through linear combinations of those means.
What Makes a Contrast Orthogonal?
A contrast is a linear combination of group means with coefficients (weights) assigned to each mean, and the sum of those coefficients equals zero.
For example:
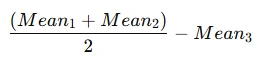
This contrast compares the average of two groups (Mean1 and Mean2) with the third group (Mean3). The weights here are +0.5, +0.5, and -1.0, and they sum to zero.
Two contrasts are orthogonal if the sum of the products of their respective weights is zero. Orthogonality ensures that the contrasts are independent of one another, meaning they partition unique portions of the variance without overlap.
Why Orthogonality Matters in ANOVA
Orthogonality has an important role in the interpretation of ANOVA results:
- It allows comparisons to be statistically independent.
- It ensures that the variance explained by one contrast does not interfere with another.
- It provides efficiency, since the total sum of squares can be partitioned cleanly into distinct parts.
By using orthogonal contrasts, students can gain deeper insights into how groups differ and avoid redundancy in hypothesis testing.
Constructing and Interpreting Orthogonal Contrasts
Once the idea of orthogonal contrasts is clear, the next step is learning how to construct them correctly and interpret their meaning.
Steps to Construct Orthogonal Contrasts
- Define Hypotheses
- Assign Weights
Start by deciding which groups or combinations of groups you want to compare. For example, comparing treatment groups with a control group is common in experimental designs.
Assign numerical weights to each mean involved in the contrast. These weights must sum to zero.
Example: To compare three treatment groups with a control group:
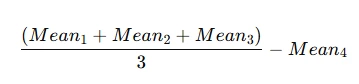
- Here the weights are +1/3, +1/3, +1/3, -1, which sum to zero.
- Check Orthogonality: If constructing multiple contrasts, multiply corresponding weights and add them across groups. If the sum is zero, the contrasts are orthogonal.
- Test the Contrast: Apply statistical procedures, such as the partial F-test, to determine whether the contrast is significant.
Interpreting Results of Orthogonal Contrasts
The interpretation involves translating statistical outcomes into meaningful conclusions:
- A significant orthogonal contrast indicates that the specified comparison among group means is supported by the data.
- If the contrast is not significant, the hypothesis about those means being different is not supported.
- Multiple orthogonal contrasts together can provide a complete picture of how groups differ in structured and non-overlapping ways.
Applications of Orthogonal Contrasts in Statistical Analysis
Orthogonal contrasts are not just theoretical concepts; they are practical tools widely used in experimental research and statistical analysis.
Testing Hypotheses Beyond the Overall F-test
While the overall F-test tells us that differences exist, orthogonal contrasts specify where those differences lie.
For example:
- Comparing control vs. all treatments.
- Comparing one treatment vs. another treatment.
- Comparing subgroups of treatments against one another.
Each of these can be framed as a contrast, and when multiple contrasts are orthogonal, they provide independent insights into the data.
Building Confidence Intervals for Contrasts
Orthogonal contrasts can also be used to construct confidence intervals for specific group comparisons. This allows students and researchers to not only test hypotheses but also quantify the range of likely differences between means. For example, a 95% confidence interval for a contrast shows the interval within which the true value of the difference is likely to lie.
Advanced Considerations in Orthogonal Contrasts
As students progress in statistics, they encounter more advanced aspects of orthogonal contrasts that are important for deeper analysis.
Partial F-tests and Partitioning Variance
Orthogonal contrasts provide a foundation for conducting partial F-tests. These tests evaluate whether specific contrasts explain significant portions of the total variance. Because orthogonal contrasts are independent, each one partitions a unique portion of the variance, making the results clearer and more interpretable.
For example, in a study with four groups, you could design three orthogonal contrasts that together explain all the variance among means. Each contrast would focus on a different hypothesis, and the sum of their variances would equal the total between-group variance.
Common Challenges in Constructing Orthogonal Contrasts
Students often face challenges such as:
- Choosing weights that sum to zero but still represent the intended hypothesis.
- Ensuring orthogonality when multiple contrasts are involved.
- Interpreting contrasts in the context of the research question.
Overcoming these challenges requires practice and careful attention to the mathematical rules of contrasts.
Practical Examples of Orthogonal Contrasts in ANOVA
Concrete examples help clarify abstract statistical concepts, and orthogonal contrasts are no exception.
Example 1: Comparing Treatments to a Control
Imagine an experiment with four groups: Control (C), Treatment 1 (T1), Treatment 2 (T2), and Treatment 3 (T3).
Contrast 1: Compare control with the average of all treatments:
Weights = -3, +1, +1, +1
Contrast 2: Compare T1 with T2:
Weights = 0, +1, -1, 0
Contrast 3: Compare average of T1 and T2 with T3:
Weights = 0, +0.5, +0.5, -1
Each contrast is independent, and together they partition the between-group variance.
Example 2: Educational Intervention Study
Suppose three different teaching methods are compared against a standard method.
Contrasts could be set up as:
- Contrast 1: Standard method vs. average of three new methods.
- Contrast 2: New Method A vs. New Method B.
- Contrast 3: Average of New Methods A and B vs. New Method C.
These contrasts provide detailed insight into how different teaching strategies affect student performance.
Conclusion
Orthogonal contrasts of means in ANOVA are a powerful statistical technique that goes beyond the basic F-test. They allow students and researchers to ask more specific questions, test targeted hypotheses, and partition variance in meaningful ways. By constructing and interpreting orthogonal contrasts correctly, one can gain a clearer understanding of group differences and their implications.
For students working on ANOVA assignments, understanding orthogonal contrasts equips them with the skills to not only detect differences among means but also explain where those differences lie. Whether through hypothesis testing, confidence interval estimation, or partial F-tests, orthogonal contrasts remain an essential component of advanced statistical analysis.