Sample Assignment Solution: Analyzing Default Probability and GDP Growth

- Problem Description:
- Question 1: Default Prediction
- Question 2: Scatter Plot of Predicted Probabilities
In this sample assignment solution, we delve into two distinct data analysis tasks. First, we explore the prediction of customer default in credit card debt, employing a probit model to estimate the relationship between balance and default probability. The results provide insights into credit risk assessment. Next, we turn our attention to GDP growth analysis for Korea, visualizing historical trends and autocorrelations in GDP growth rates. We then make a prediction for GDP growth in the second quarter of 2023, showcasing the practical application of time series modeling. This sample provides a concise yet informative overview of these data analysis processes.
Problem Description:
In the data analysis assignment, we explore the prediction of default in a customer's credit card debt based on their balance using a probit model. We are provided with data in "Default.xlsx," which includes information on 10,000 observations with four variables: default (indicating whether the customer defaulted on their debt), student (indicating whether the customer is a student), balance (the average balance remaining after monthly payments), and income (customer's income).
Question 1: Default Prediction
We estimate the probit model:
Pr(Default=1∣balance)=ϕ(β0+β1∗balance)
Given equation: Pr(Default=1∣balance)=ϕ(5.352−2.711∗balance)
The estimate for β1 is -2.711.
Question 2: Scatter Plot of Predicted Probabilities
We visualize the relationship between predicted probabilities and balance with a scatter plot, placing balance on the horizontal axis.
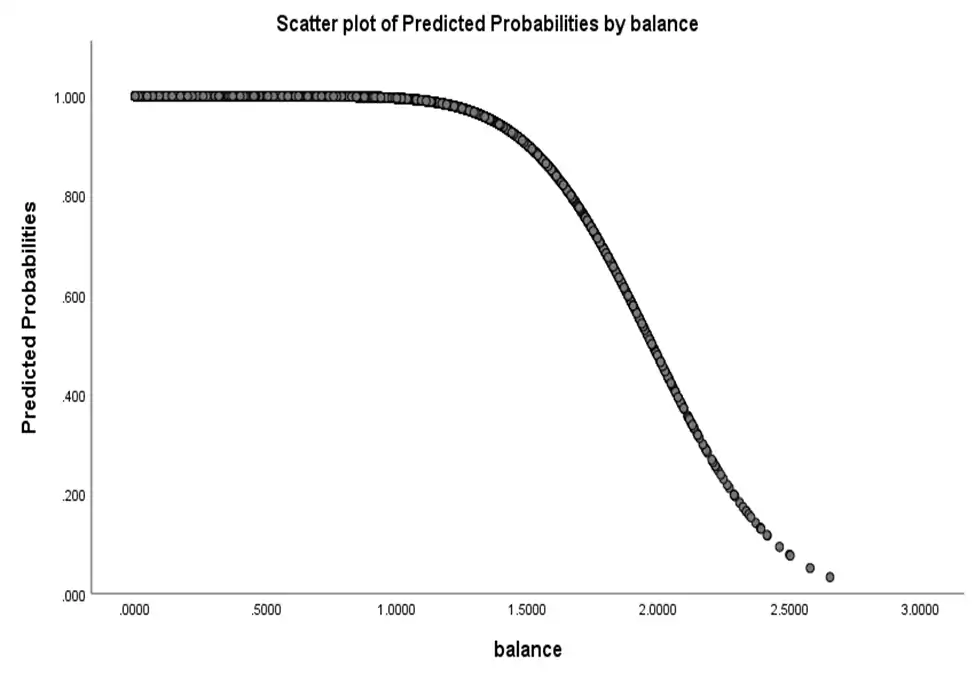
- Fig 1: Scatter plot of predicted probabilities by balance
Question 3: GDP Growth Analysis
For this part of the assignment, we use data from "gdpgr_korea.xlsx," providing quarterly GDP growth data for Korea, where "GDPGR" is the annualized growth rate of real GDP (%).
Question 3: Time Series Plot of GDP Growth
We create a time series plot of GDPGR to explore trends and fluctuations in Korea's GDP growth.
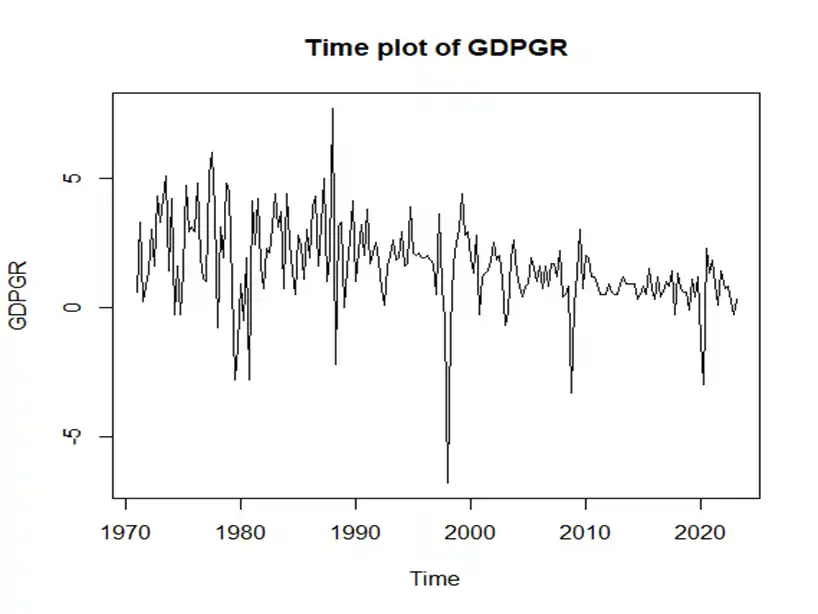
- Fig 2: Time Plot of GDPGR
Question 4: Autocorrelation Analysis
We calculate the first autocorrelation of GDPGR to understand the dependence between GDP growth rates in consecutive quarters (result: 0.2808).
Question 5: GDP Growth Prediction
Using an AR(2) model for GDPGR, we predict GDP growth in the second quarter of 2023, providing point forecasts and confidence intervals:
- Point Forecast for 2023 Q2: 1.012657
- 80% Confidence Interval: [-1.030577, 3.05589]
- 95% Confidence Interval: [-2.112199, 4.137512]
The estimated GDP growth for Q2 2023 is 1.01.
Related Samples
Explore our sample section to delve deeper into various statistical concepts. Discover a plethora of examples illustrating statistical analysis methods, hypothesis testing, data visualization, and more. Enhance your understanding through practical instances tailored to aid your learning journey. From descriptive statistics to advanced techniques, uncover insightful samples to bolster your statistical prowess.
Data Analysis
Data Analysis
Data Analysis
Data Analysis
Statistics
Data Analysis
tableau
Data Analysis
Data Analysis
Data Analysis
Data Analysis
Data Analysis
Data Analysis
R Programming
Data Analysis
Data Analysis
Data Analysis
Data Analysis
Data Analysis
Data Analysis