In this comprehensive statistical analysis, we delve into three distinct scenarios, each offering unique insights into non-parametric testing and relationship exploration. Scenario 1 explores political party affiliation changes during the COVID-19 pandemic, revealing that the pandemic did not significantly impact party affiliations. In Scenario 2, we investigate the relationship between gender and pet ownership, concluding that gender does not influence the choice of pets owned. Finally, in Scenario 3, we examine the connection between sport choice and binge-drinking among male student-athletes, finding no significant association. These analyses showcase the power of non-parametric tests and their applications in various real-world scenarios.
Problem Description
This content delves into the practical application of non-parametric tests and relationship exploration in statistical analysis scenarios, specifically focusing on the Statistical Analysis assignment. Three unique situations are explored as part of this assignment, including the impact of the COVID-19 pandemic on political party affiliations, the connection between gender and pet ownership, and the correlation between sports choices and binge-drinking habits among male student-athletes. These case studies provide valuable insights into non-parametric testing and its real-world implications.
Scenario 1: Analyzing Political Party Affiliation Changes During the COVID-19 Pandemic
This assignment aims to assess your ability to conduct non-parametric tests using SPSS and present the results in an organized and clear manner. Non-parametric tests are essential when dealing with nominal data or when data fail to meet the assumptions required for parametric tests. In this scenario, we explore whether there is a significant change in political party affiliations during the COVID-19 pandemic compared to pre-pandemic times in a local precinct.
Method
- Variable of Interest:Party affiliation with three levels: Republican, Democrat, and Others.
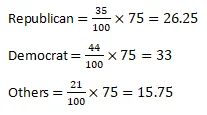
- Expected Frequencies:

Results
A chi-square goodness-of-fit test was conducted to assess the similarity between party affiliation during the recent COVID-19 pandemic and pre-pandemic affiliation. The test results indicate that there is no significant difference between the two time periods (x2 (2,N=75) = 1.48, p = .477) Therefore, we conclude that party affiliation during the pandemic remains consistent with the pre-pandemic era. This result suggests that the event of COVID-19 did not influence party affiliation significantly.
Test Statistics
| party | |
| Chi-Square df Asymp. Sig. | 1.479a 2 .477 |
0 cells (0.0%) have expected frequencies less than 5. The minimum expected cell frequency is 15.8.
Scenario 2: Analyzing the Relationship Between Gender and Pet Ownership
This analysis aims to determine whether there is a significant association between an individual's gender and their ownership of pets, including dogs, cats, and reptiles. The results of a chi-square test are presented following the APA format.
Method
- Variables of Interest:
- Gender levels: Male and Female
- Pet ownership with three levels:Dog, Cat, and Reptile
Results
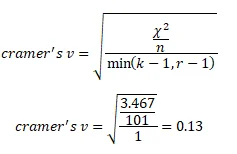
A chi-square test of independence was conducted to examine the association between gender and pet ownership. The results indicate no significant association between gender and pet ownership, as the null hypothesis cannot be rejected (χ^2 (2, N=101) = 3.47, p = .177). This finding suggests that gender does not play a significant role in determining the type of pet individuals own.
The effect size is calculated as

The critical value with alpha of 0.05 and 2 degrees of freedom is 5.991. The obtained value from SPSS output is 3.47. The result showed that the test statistic (3.47) is less than the critical value (5.991) which connotes non-rejection of null hypothesis. therefore, we cannot reject the null hypothesis and this means there is no significant difference.
Scenario 3: Analyzing the Relationship Between Sport and Binge-Drinking Among Male Student-Athletes
This analysis investigates whether the choice of sport is associated with binge-drinking habits among male student-athletes. The data collected from 93 respondents are examined using a chi-square test, and the results are presented following the APA format.
Method
- Variables of Interest:
- Binge drinking with two levels:Yes and No
- Type of sport with three levels: Lacrosse, Hockey, and Swimming
Results
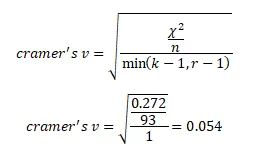
A chi-square test of independence was conducted to determine if there is a significant association between binge-drinking and the type of sport engaged in by male student-athletes. The results indicate that there is no significant association (χ^2 (2, N=93) = 0.272, p = .873). This implies that the type of sport a male student-athlete chooses does not significantly affect their likelihood of engaging in binge-drinking.
The effect size is:

The critical value with alpha of .05 and 2 degrees of freedom is 5.991. The obtained value from SPSS output is 0.27. The result showed that the test statistic (0.27) is less than the critical value (5.991) which connotes non-rejection of null hypothesis. therefore, we cannot reject the null hypothesis and this means there is no significant difference
Related Samples
Discover a range of excellent assignments in our sample section, showcasing our statistical solutions. Each sample demonstrates our expertise in analyzing statistics with clarity and precision. See firsthand how we can assist you effectively with your statistical needs. Get inspired by our samples and gain confidence in tackling your own statistical challenges.
Statistics
Statistics
Statistics
Statistics
Statistics
Statistics
Statistics
Statistics
Statistical Tests
Statistics
Statistics
Statistics
Statistics
Statistics
Statistics
Statistics
Statistics
Statistics
Statistics
Statistics
