In our comprehensive analysis, we delve into the intricate world of football statistics. This project investigates the influential factors that determine a football team's success. We rigorously examine various independent variables to unveil their impact on the win percentage. Through correlation analysis and multiple linear regression, we identify the key contributors, leading to a robust predictive model. Our findings offer valuable insights into the dynamics of football performance and inform strategies for achieving victory on the field.
Problem Description
In the regression analysis assignment, we explore the intricate world of football statistics through regression analysis. Our goal is to unveil the key factors that influence a football team's win percentage. To do this, we analyze various independent variables to understand their relationships with the dependent variable, 'WinPCT,' which signifies the percentage of games won in a regular season.
Dataset: We collected data on several independent variables, including:
| Variable | Description |
|---|---|
| 'Pass_Completion_Percent' | The quarterback's successful pass percentage. |
| 'Off_Pass_Yards_Per_Att' | Average yards gained per pass attempt. |
| 'Off_Rush_Yards_Per_Carry' | Average yards gained per carry. |
| 'Off_Pass_Touchdown' | The number of touchdowns scored through passing. |
| 'Off_Rush_Touchdowns' | The number of touchdowns scored through rushing. |
| 'Off_Pass_Interceptions' | Unwanted interceptions during passes. |
| 'Off_Rush_Fumbles' | Fumbles during rushing plays. |
| 'Def_Pass_Yards_by_Opponent_Per_Att' | Average yards gained by opposing teams per pass attempt. |
| 'Def_Rush_Yards_by_Opponent_Per_Att' | Average yards gained by opposing teams per carry. |
| 'Def_Touchdowns_By_Opponents' | Touchdowns scored by opposing teams. |
| 'Def_Interceptions' | Interceptions made by the defense. |
| 'Def_QB_Sacks' | Quarterback sacks made by the defense. |
| 'SpecTeams_FG_Total' | Total field goals made by the special teams. |
| 'SpecTeams_FGpct' | Field goal percentage of the special teams. |
| 'SpecTeams_XPpct' | Extra point percentage of the special teams. |
- Table 1: Independent variables
We aim to identify which of these variables have the most significant impact on a team's success on the football field.
Model Selection Process: We began our analysis by calculating the correlation between each independent variable and the win percentage. We found that 7 variables showed a significant correlation with 'WinPCT.' To understand their combined effect, we performed a multiple linear regression analysis. The results led us to select three significant variables for our final model: 'Off_Pass_Touchdown,' 'Off_Rush_Touchdowns,' and 'Def_Interceptions,' which collectively explained 81% of the variation in 'WinPCT.'
Model Strength Assessment: Our regression model yielded crucial statistics:
- R-Square: The model accounted for 81% of the variability in 'WinPCT,' demonstrating its strength.
- F-Test: The F-value of 39.68, with a p-value of 0.00, indicates that the model as a whole is statistically significant.
- T-Test: Examining each variable's contribution, 'Off_Pass_Touchdown' and 'Off_Rush_Touchdowns' positively influenced 'WinPCT,' while 'Def_Interceptions' had a negative impact.
Interpretations of the Model: The final regression model is as follows: WinPCT = 34.53 + 1.66*(Off_Pass_Touchdown) + 1.49*(Off_Rush_Touchdowns) - 1.19*(Def_Interceptions)
For instance, the coefficient of 'Off_Pass_Touchdown' (1.66) suggests that for each additional passing touchdown, 'WinPCT' is expected to increase by 1.66, holding other variables constant. Based on this model, we can predict a 'WinPCT' of 78.18 for a team with specific stats.
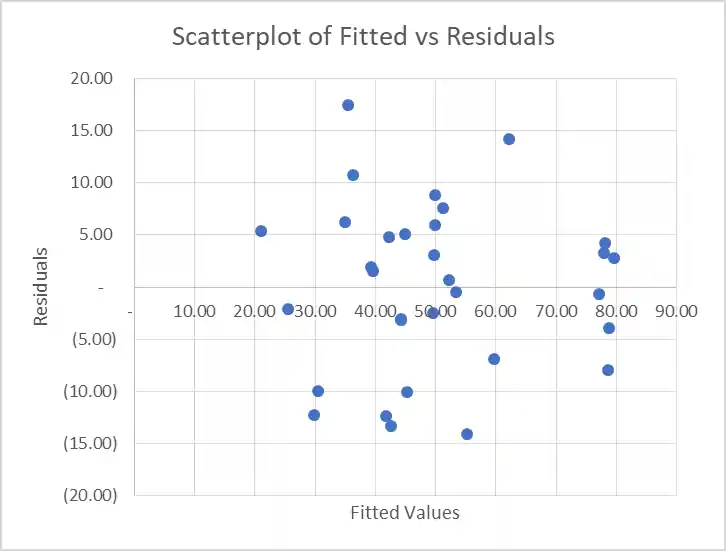
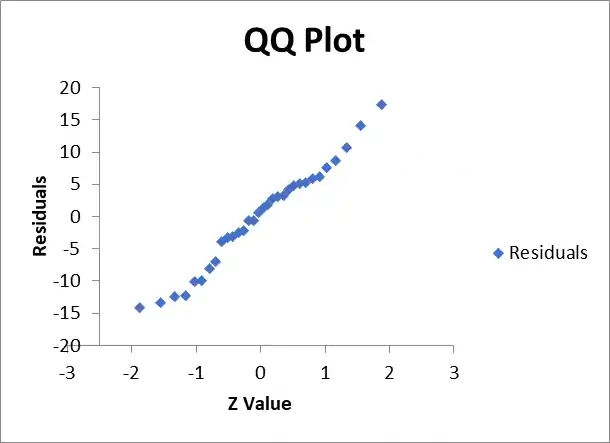
Model Fit and Assumptions: Diagnostic plots indicated that the assumptions of residuals uncorrelated with the model and homoscedasticity were met. The Q-Q plot also suggested the normality of residuals. Consequently, we are confident in the validity of our linear regression model.
Appendix:
Model 1 Results: We initially conducted a multiple linear regression analysis with all the independent variables. Here are the results:
| Coefficient | Standard Error | t Stat | P-value |
|---|---|---|---|
| Intercept | 50.84 | 0.68 | 0.51 |
| Pass_Completion_Percent | 0.10 | 0.15 | 0.88 |
| Off_Pass_Yards_Per_Att | -4.66 | -1.00 | 0.33 |
| Off_Pass_Touchdown | 1.81 | 5.04 | 0.00 |
| Off_Pass_Interceptions | -0.74 | -1.27 | 0.22 |
| Off_Rush_Yards_Per_Carry | -0.85 | -0.16 | 0.87 |
| Off_Rush_Touchdowns | 1.51 | 3.05 | 0.01 |
| Off_Rush_Fumbles | 0.29 | 0.39 | 0.70 |
| Def_Pass_Yards_by_Opponent_Per_Att | 5.13 | 1.03 | 0.32 |
| Def_Rush_Yards_by_Opponent_Per_Att | -0.64 | -0.13 | 0.90 |
| Def_Touchdowns_By_Opponents | 0.71 | 1.38 | 0.19 |
| Def_Interceptions | -1.45 | -3.21 | 0.01 |
| Def_QB_Sacks | 0.35 | 1.28 | 0.22 |
| SpecTeams_FG_Total | 0.61 | 1.15 | 0.27 |
| SpecTeams_FGpct | -0.37 | -1.12 | 0.28 |
| SpecTeams_XPpct | -0.21 | -0.50 | 0.62 |
- Table 2: Results of the Multiple Linear Regression with independent variables
Final Model Results: After eliminating non-significant variables, we obtained the following results:
| Coefficient | Standard Error | t Stat | P-value |
|---|---|---|---|
| Intercept | 34.53 | 2.96 | 0.01 |
| Off_Pass_Touchdown | 1.66 | 7.56 | 0.00 |
| Off_Rush_Touchdowns | 1.49 | 5.16 | 0.00 |
| Def_Interceptions | -1.19 | -4.80 | 0.00 |
- Table 3: Results of non-significant variables
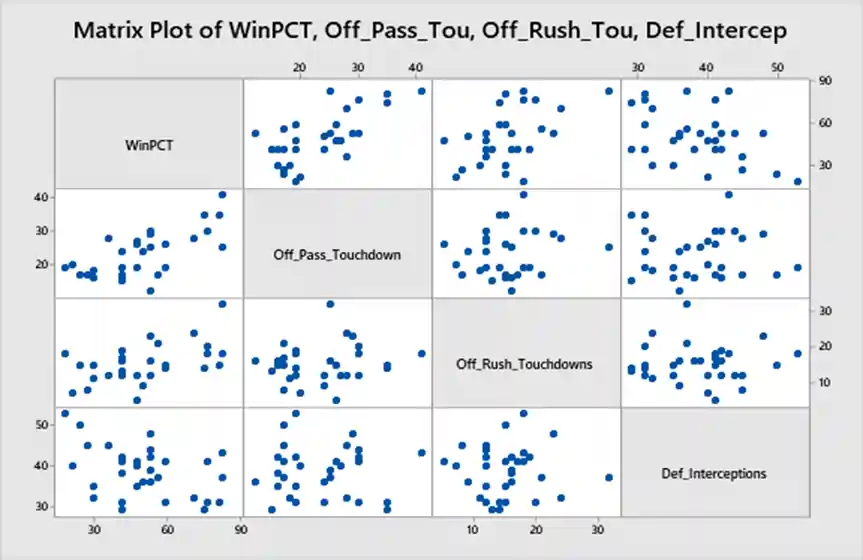
Scatterplot Matrix: Figure 1: Scatterplot matrix illustrating the relationships between win percentages and the chosen variables.

- Fig 1: Scatter plot showing the relationships between win percentages and the chosen variables.
Model Fit Diagnostic Plots: Figure 2: Scatterplot showing the relationship between fitted values and residuals. There is no systematic pattern.

- Fig 2: Scatterplot showing the relationship between fitted values and residuals
Figure 3: Normal Q-Q plot of residuals demonstrating normality.
These diagnostic plots support the validity of our linear regression model and suggest that the key assumptions have been met.

Figure 3: Normal Q-Q plot of residuals
Related Samples
Explore our extensive sample section to gain insight into various statistics assignments. Discover a wide array of examples covering topics such as hypothesis testing, regression analysis, and data visualization. These samples offer practical illustrations to enhance your understanding and excel in your statistics studies. Dive in to sharpen your skills and ace your assignments with confidence!
Statistics
Statistics
Data Analysis
Statistics
Statistics
Statistics
Statistics
Statistics
Statistics
Data Analysis
Data Analysis
Data Analysis
Statistics
Statistics
Statistics
Data Analysis
Statistics
tableau
Data Analysis
Statistics
