Unmasking Insights: Biostatistical Analysis of COVID-19 Impact on University Students

- Problem Description:
- Question 1:
- Solutions:
Delve into a rigorous Biostatistics examination of COVID-19's impact on University of Sydney students. From refining the population of interest to uncovering patterns in COVID-19 distribution across employment levels, this analysis navigates intricate datasets. Rigorous data cleaning and variable analyses ensure robust conclusions, while a one-sample t-test reveals significant disparities in unpaid domestic work, shedding light on the broader implications of the pandemic on student life.
Problem Description:
This assignment on Biostatistics focuses on the data analysis of a study concerning the spread and infection of COVID-19 among students at the University of Sydney. The dataset includes various variables related to demographics, health, and COVID-19 experiences. The goal is to apply statistical methods to gain insights into the data, identify patterns, and draw meaningful conclusions.
Question 1:
- Population of interest includes a group of aspects not limited to human subjects that have something in common (Bloomfield& Fisher,2019). This study focuses on COVID-19 spread and infection among students within the University of Sydney, thus, students of the University of Sydney are the population of interest for this study.
- Non-sampling errors are various sources of errors that are not related to sampling and are usually present in all types of surveys. Thus, there is a possibility of non-sampling error in this data. In this data set, non-sampling error in this data set can occur from missing data or respondent error where respondents could possibly provide incorrect answers or tend to exaggerate or underplay events (Chen Haziza, 2019).
- In for this population of interest, non-sampling error can be minimized by increasing the sample size and randomizing selection to eliminate biases that may exist within the selected sample.
Solutions:
Population of Interest and Non-Sampling Errors
Population of Interest:
- The population of interest for this study comprises students at the University of Sydney, emphasizing their experiences with COVID-19.
Non-Sampling Errors:
- Non-sampling errors, such as missing data and respondent errors, can influence the dataset. To minimize these errors, increasing the sample size and randomizing selection are suggested strategies.
Question 2:Data Cleaning and Variable Analysis
• Age:
- Omitted 12 missing and implausible age values, resulting in 94 valid observations.
Livewith:
- Removed 5 missing and implausible livewith values, leaving 91 valid observations.
Willing:
- Deleted 1 missing value in the "Willing" variable, resulting in 91 valid observations.
Question 3: Statistical Confidence Score Analysis
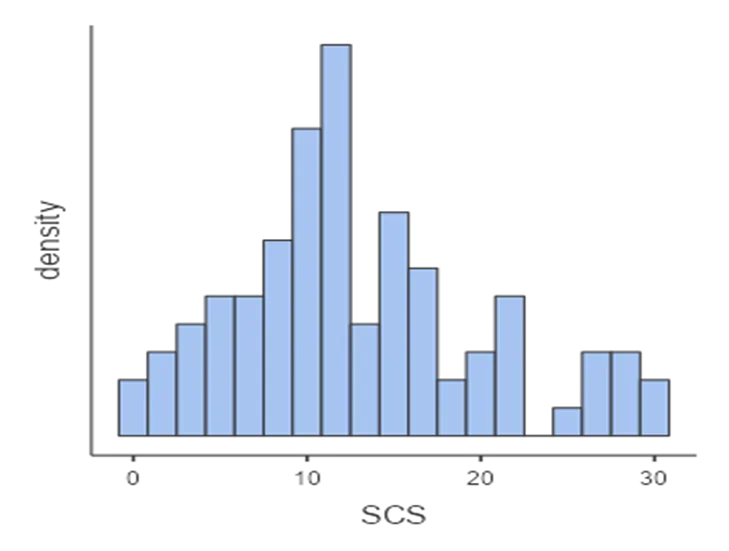
Figure 1:Histogram showing statistical confidence score for the participants
Histogram:
- Presents a histogram showing the statistical confidence scores of participants.
- Noteworthy points include an unimodal, normally distributed shape with a mean value of 13.0 (SD 7.23).
Question 4: Two-Way Contingency Table Analysis
Table 1:
| Meets recommended vegetable intake | Does not meet vegetable intake | Total | |
| Male (2) | 0 | 25 | 25 |
| Female (1) | 1 | 64 | 65 |
| Total | 1 | 89 | 90 |
Table 2: Two-way contingency table for vege and sex
Vegetable Intake and Sex:
- Illustrates a two-way contingency table, emphasizing the gender distribution and adherence to vegetable intake recommendations.
- Majority of participants do not meet recommended vegetable intake; only 1 female meets the recommendations.
Question 5: COVID Distribution Among Employment Levels
Figure 2:
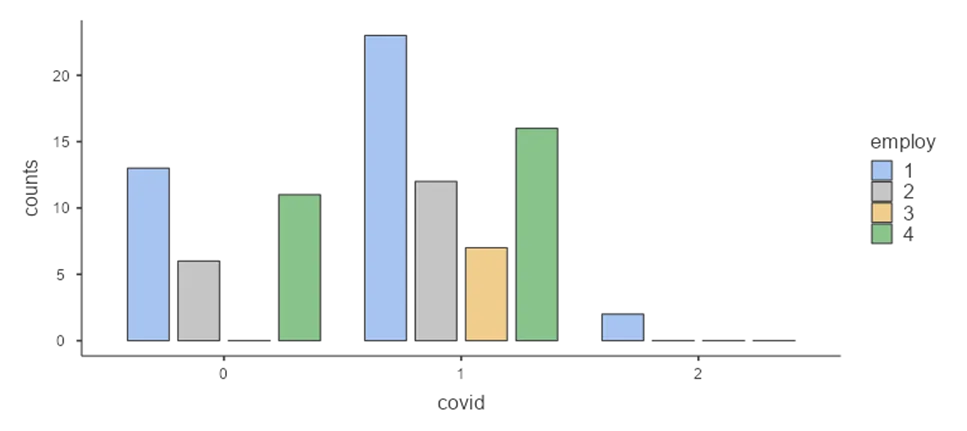
Figure 2: Bar plot showing distribution of covid among employment levels
Bar Plot:
- Displays the distribution of COVID cases among different employment levels.
- Notable patterns include full-time employed participants having the highest count in various COVID-related scenarios.
Question 6:Descriptive Statistics and Frequency Distribution
Table 1: Descriptive Statistics:
- Presents descriptive statistics for age and fruit consumption.
- Provides frequency distribution for degree, COVID status, and the year of contracting COVID.
Question 7:
Table 2: One sample t-test results
| Variable | Statistic | df | P | |
| Housewk | Student’s t | -8.10 | 88.0 | .001 |
One Sample t-test for Domestic Work
Conducts a one-sample t-test to test the hypothesis regarding the amount of unpaid domestic work.
Test Hypotheses:
- H0: µ = 360
- H1: µ ≠ 360
Results indicate a significant difference, leading to the rejection of the null hypothesis.
This comprehensive analysis provides a detailed overview of the dataset, ensuring clarity and understanding of the applied statistical methods and their implications.
Related Samples
Explore a plethora of diverse statistical samples curated to enhance your understanding and mastery of statistical concepts. Our sample section offers a rich array of real-world data sets, case studies, and problem-solving scenarios, tailored to cater to various academic levels and topics. Dive into these meticulously crafted samples to sharpen your analytical skills and excel in your statistical endeavors. Whether you're a student, researcher, or practitioner, our comprehensive collection is designed to support your learning journey effectively.
Biostatistics
Biostatistics
Biostatistics