
Problem Description:
The descriptive statistics assignment aims to conduct a comprehensive analysis of a dataset containing information about various factors related to newborns, such as birth weight, surgery type, prematurity, gender, gestational age, and more. The dataset comprises 141 observations and 8 variables.
Part 1: Introduction
In this section, we introduce the dataset and its variables. The variables include Gender, Place, birth, Gestation, length, infection, Prematurity, and Surgery, each with specific characteristics. The subsequent sections delve into the analysis of categorical and continuous variables.
Part 2: Categorical Variables Analysis
This part of the report explores the statistical relationship between gender and the place of birth. A frequency table is presented, revealing insightful patterns in the distribution across different places for males and females. The findings are visually represented through a bar plot, emphasizing the disparities observed in local, regional, and overseas locations.
Table 1: Frequency Tables of Gender Split by Place
| gender | place | Counts | % of Total | Cumulative % | |||||
|---|---|---|---|---|---|---|---|---|---|
| Males | Regional | 18 | 13.6 % | 13.6 % | |||||
| Local | 54 | 40.9 % | 54.5 % | ||||||
| Overseas | 4 | 3.0 % | 57.6 % | ||||||
| Females | Regional | 15 | 11.4 % | 68.9 % | |||||
| Local | 36 | 27.3 % | 96.2 % | ||||||
| Overseas | 5 | 3.8 % | 100.0 % |
A graphical representation reinforces the findings, highlighting the dominance of local places and gender-specific variations. The bar plot is the most appropriate plot to represent this table.
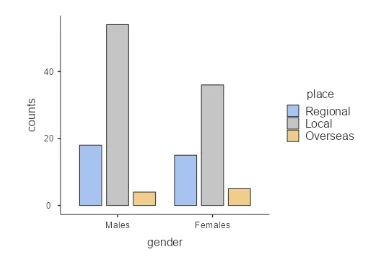
Figure 1: Bar plot of the gender split by place
Part 3: Continuous Variable Analysis
This section focuses on the analysis of continuous variables, particularly birth weight concerning prematurity. Descriptive statistics are provided, indicating mean, median, standard deviation, and percentiles for both premature and term births. Accompanying this, a histogram and density plot visually illustrate the distribution of birth weight.
Table 2: Descriptive Statistics of Birthwt by Premature
| Descriptives | |||||||||||||||
|---|---|---|---|---|---|---|---|---|---|---|---|---|---|---|---|
| Percentiles | |||||||||||||||
| prematur | N | Mean | Median | SD | 25th | 75th | |||||||||
| birthwt | Premature | 45 | 2428 | 2400 | 482 | 2116 | 2780 | ||||||||
| Term | 96 | 2477 | 2443 | 530 | 2010 | 2874 |
Figure 2: Histogram and Density Plot of Birthweight
The density plot reveals distinct peaks for both premature and term births, deviating from a normal distribution. A theoretical normal distribution plot with a mean of 2500 and a standard deviation of 500 is presented for comparison in Figure 3.
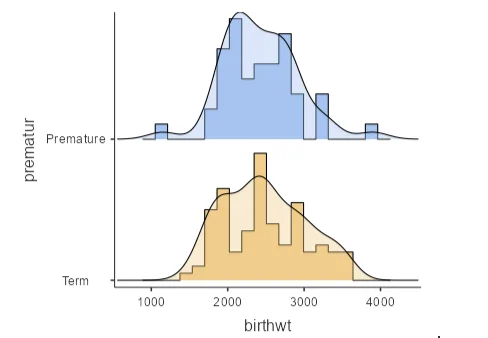
Figure 2: Histogram and Density Plot of Birthweight
Figure 3: Theoretical Plot of Normal Distribution with Mean = 2500 and SD = 500
Comparisons with theoretical distributions lead to the conclusion that the birth weight distributions differ. Further statistical analysis, including confidence intervals, supports the claim that there is insufficient evidence to refute the assertion that the true mean of birth weight for term and preterm babies is the same. The 95% confidence interval for the difference in mean birth weight is [-234, 134].
In summary, the analysis provides valuable insights into the relationships within the dataset, emphasizing the importance of both categorical and continuous variables in understanding birth weight patterns.
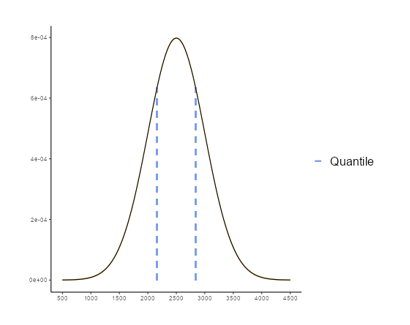
Figure 3: Theoretical Plot of Normal Distribution with Mean = 2500 and SD = 500