
Problem Description:
In Descriptive Statistics assignment, we are tasked with examining the distribution of data related to the lower division and upper division students' academic performance, specifically their GPAs and Quiz 3 scores. Our objective is to gain insights into the skewness, kurtosis, and overall distribution characteristics of these variables.
Solution
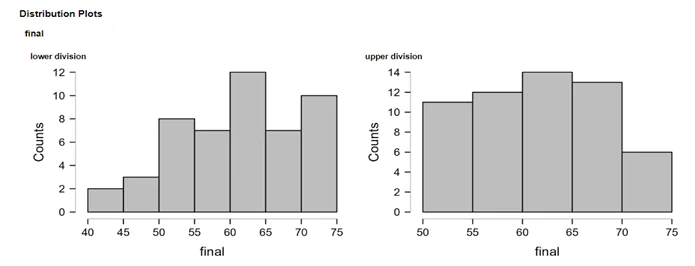
From the histogram of lower division we can see that it is left (negatively) skewed.
From the histogram of upper division we can see that it is roughly uniform with a slight skewness towards right (positively) skewed.
Descriptive Statistics
| GPA | Quiz3 | |
| Mean | 2.862 | 7.133 |
| Std. Deviation | 0.713 | 1.600 |
| Skewness | -0.220 | -0.078 |
| Std. Error of Skewness | 0.236 | 0.236 |
| Kurtosis | -0.688 | 0.149 |
| Std. Error of Kurtosis | 0.467 | 0.467 |
Mean GPA =2.862, which means average GPA for students is 2.862.
Std. deviation of GPA =0.713, which means average deviation of GPA for students is 0.713.
Skewness for gpa is -0.220 which is not very much different from 0 so we can say that gpa is approximately symmetric distributed.
Kurtosis for gpa is -0.688 which means gpa is approximately normally distributed with slightly lighter tails than normal distribution.
Mean quiz3 score =7.133, which means average quiz3 score for students is 7.133.
Std. deviation of quiz3 score =1.600, which means average deviation of quiz3 score for students is 1.600.
Skewness for quiz3 score is -0.078 which is approximately 0 so we can say that quiz3 score is approximately symmetric distributed.
Kurtosis for quiz3 score is -0.149 which means quiz3 score is approximately normally distributed.