
Problem Description:
Our experts have examined various concepts in statistics and data manipulation using the R programming language. The R Programming assignment covers topics such as inferential statistics, anxiety measurement scales, data types, mathematical calculations, and data transformations. Each problem is structured with explanations and relevant code snippets. Here's a structured and presentable version of the assignment solution:
Solution
Inferential Statistics and Probability:
We start by discussing the significance of inferential statistics, which involves drawing conclusions about a population based on sample data. This concept is intertwined with the essential role that probability plays in making predictions about the likelihood of events occurring.
1. Inferential statistics deals with making inferences about the population from which samples are drawn. In making this generalization, probability is needed since it deals with predicting the likelihood of an event occurring.
2.
- The State-Trait Anxiety Inventory
To measure via self-report the presence and severity of current symptoms of anxiety and a generalized propensity to be anxious. Versions of this measure are available for both adults and children.
There are 2 subscales within this measure. First, the State Anxiety Scale (S-Anxiety) evaluates the current state of anxiety, asking how respondents feel “right now,” using items that measure subjective feelings of apprehension, tension, nervousness, worry, and activation/arousal of the autonomic nervous system. The Trait Anxiety Scale (T-Anxiety) evaluates relatively stable aspects of “anxiety proneness,” including general states of calmness, confidence, and security.
The STAI has 40 items, 20 items allocated to each of the S-Anxiety and T-Anxiety subscales. There is also a STAI for children (STAIC) with the same number of items. Short versions of the scales have been developed independently (2–4). Responses for the S-Anxiety scale assess intensity of current feelings “at this moment”: 1) not at all, 2) somewhat, 3) moderately so, and 4) very much so. Responses for the T-Anxiety scale assess frequency of feelings “in general”: 1) almost never, 2) sometimes, 3) often, and 4) almost always. (LAURA J. JULIAN, 2011)
- Beck Anxiety Inventory
The BAI is a brief measure of anxiety with a focus on somatic symptoms of anxiety that was developed as a measure adept at discriminating between anxiety and depression (18).
The BAI is administered via self-report and includes assessment of symptoms such as nervousness, dizziness, inability to relax, etc.
The BAI has a total of 21 items. Respondents indicate how much they have been bothered by each symptom over the past week. Responses are rated on a 4-point Likert scale and range from 0 (not at all) to 3 (severely). (LAURA J. JULIAN, 2011)
3.
x=c(2,3,TRUE,5,4,FALSE,8,TRUE,FALSE)
str(x)
class(x)
sum(x)
mean(x)
The data type is numeric. It is coercion with built-in object types that occurred, R does the coercion implicitly. The sum is 24 while the mean is 2.6667, R converts TRUE to 1 and FALSE to zero.
4.
X=c(3,2,7,8)
N=4
Xbar=sum(x)/N
sum((X-Xbar)^4)/N
Ans. 1648.5
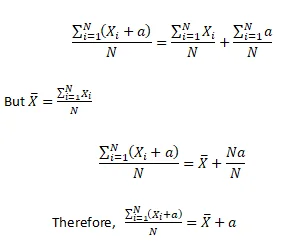
5.
6.
grades=c(70,65,75,80,63,90,71,75,93,83)
var(grades)
gradesadd5=grades+5
var(gradesadd5)
gradessub5=grades-5
var(gradessub5)
gradesmul5=grades*5
var(gradesmul5)
gradesdiv5=grades/5
var(gradesdiv5)
Var(grades) = 100.0556
- The teacher added 5 marks to everyone’s grades
Variance = 100.0556
- The teacher subtracted 5 marks to everyone’s grades
Variance = 100.0556
- The teacher multiplied everyone’s grades by 5
Variance = 2501.389
- The teacher divided everyone’s grades by 5
Variance = 4.002222
7.
- Variance remains unchanged
- Variance remains unchanged
- Variance is multiplied by a2
- Variance is divided by a2
8.
grades=c(70,65,75,80,63,90,71,75,93,83)
sd(grades)
gradesadd5=grades+5
sd(gradesadd5)
gradessub5=grades-5
sd(gradessub5)
gradesmul5=grades*5
sd(gradesmul5)
gradesdiv5=grades/5
sd(gradesdiv5)
sd(grades) = 10.00278
- The teacher added 5 marks to everyone’s grades
Standard deviation = 10.00278
- The teacher subtracted 5 marks to everyone’s grades
Standard deviation = 10.00278
- The teacher multiplied everyone’s grades by 5
Standard deviation = 50.01389
- The teacher divided everyone’s grades by 5
Standard deviation = 2.000555
- Standard deviation remains unchanged
- Standard deviation remains unchanged
- Standard deviation is multiplied by a
- Standard deviation is divided by a
10.
- c(10,3,6,9,20,1,4,5)
- x=c(10,3,6,9,20,1,4,5)
- y=x
- print(x);print(y)
- var(x);var(y) variance of x is 35.35714 and the variance of y is 35.35714
- cov(x,y) the covariance between x and y is 35.35714
- Variance of x and covariance between x and y are the same.
- cor(x,y) the correlation between x and y is 1
11.
- Sort () function is used for sorting or ordering vectors in either ascending or descending order.
- The function argument decreasing is used to specify whether the vector is sorted in ascending or descending
- The data type for the input argument decreasing is logical
- Yes, the argument decreasing has a default input, it is FALSE