
Problem Description
In an ongoing quest to enhance teaching methods, a new approach was introduced for a geography course, and its effectiveness needed assessment. To gauge this, a group of 42 randomly selected students participated in a survey where their scores were recorded both before and after the implementation of the new teaching method. This statistical analysis assignment aims to evaluate the effectiveness of the new teaching method, specifically focusing on test effectiveness using results before and after using StatCrunch Statistics.
Summary Statistics
| Pre-Test | Post-Test | |
|---|---|---|
| Mean | 67.14 | 73.62 |
| Median | 68 | 72 |
- Table 1: summary statistics for the pre-test and post-test scores.
From Table 1, we can observe that the average score of students improved from 67.14 on the pre-test to 73.62 on the post-test. Additionally, the median score increased from 68 to 72. These findings clearly indicate that the post-test scores are higher than the pre-test scores.
Lower and Upper Quartiles
| Pre-Test | Post-Test | |
|---|---|---|
| Q1 | 54 | 64 |
| Q3 | 80 | 86 |
- Table 2: Quartiles for both pre-test and post-test scores,essential in constructing box plots.
The quartiles (Q1 and Q3) represent the 25th and 75th percentiles, respectively. These values reveal that 25% of the students scored 54 or lower on the pre-test (Q1), while 75% scored 80 or lower (Q3). In contrast, 25% of the students scored 64 or lower on the post-test (Q1), and 75% scored 86 or lower (Q3). Quartiles provide a foundation for constructing box plots, which we'll explore next.
Box Plots Figure 1 displays the box plots for both pre-test and post-test scores, which help visualize the distribution and key statistics of the data.
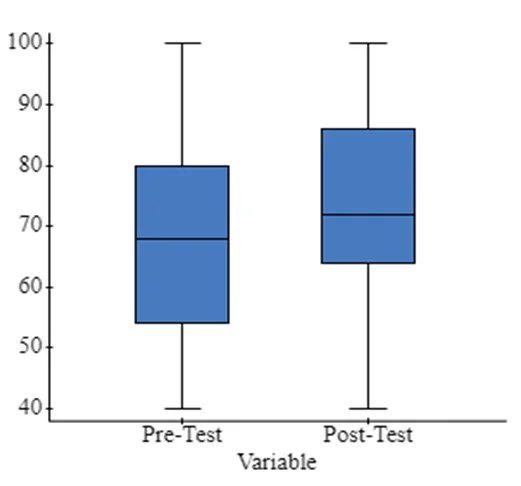
- Figure 1: Box plots for re-test and post-test scores
The box plots demonstrate that both pre-test and post-test scores have a minimum of 40 and a maximum of 100. The boxes represent the interquartile range, and in this case, both variables have a similar interquartile range. While no outliers are evident in either dataset, the distribution of pre-test scores appears roughly normal, whereas post-test scores show a right-skewed distribution.
The median, represented by the middle line of each box, is higher for post-test scores than pre-test scores. To determine the significance of the difference in means between the two variables, a test of significance, such as a paired sample t-test, is recommended, as the box plots alone do not provide definitive evidence of significance.
Scatter Plot Figure 2 showcases a scatter plot of post-test scores against pre-test scores, revealing a notable pattern in the data.
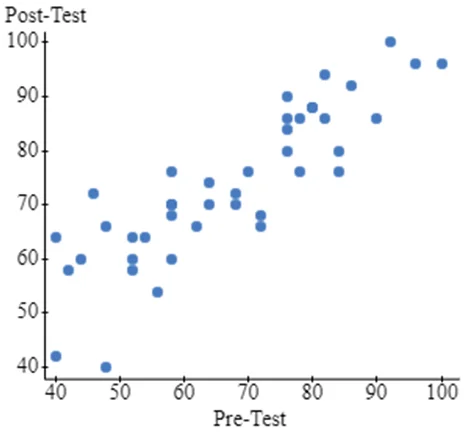
- Figure 2: Scatter plot of Post-test against Pre-test
The scatter plot indicates an upward trend, suggesting a strong and positive linear correlation between pre-test and post-test scores. The equation of the regression line for this correlation is as follows:
Post Test = 22.899 + 0.755 (Pre Test)
The slope of 0.755 implies that for every unit increase in pre-test score, the post-test score increases by 0.755. The intercept of 22.899 means that the expected post-test score is 22.90 when the pre-test score is held constant.
For instance, if someone had a pre-test score of 37, their predicted post-test score using the regression line would be 50.83.
Conclusion
The statistical analysis conducted using StatCrunch Statistics shows promising improvements in student performance after implementing the new teaching method. However, to confirm the significance of this improvement, further statistical testing, such as a paired sample t-test, is recommended. The strong positive correlation between pre-test and post-test scores suggests that higher pre-test scores are associated with higher post-test scores.