
Problem Description:
The objective of this Excel assignment is to gain practical insights into (i) utilizing EXCEL for regression analysis, (ii) interpreting regression output, and (iii) accessing and analyzing real financial data. The task involves retrieving historical stock prices from Yahoo Finance, merging data with the S&P 500 index, computing stock returns, and performing regression analysis.
Data Retrieval Steps:
- Open finance.yahoo.com.
- In the Search for news, symbol, or companies dialog box, enter the stock ticker symbol (e.g., GE).
- Click on Historical Data.
- Choose a Time Period of 5 years and Weekly Frequency. Download the data.
For S&P 500:
- Search for ^GSPC in the same dialog box, repeat steps 3 and 4, then copy-paste the data to Excel.
Data Cleaning:
- Open the downloaded spreadsheet, save it as an Excel workbook, and delete unnecessary columns.
Analysis using Excel:
Select Insert and then Chart from Excel. Follow the steps to construct a scatter diagram between this period’s (Rt) and the previous period’s return (Rt-1). Attach the graph below. (You can do the pasting “electronically” or by first printing the regression output and then cutting the relevant part of your printout.)
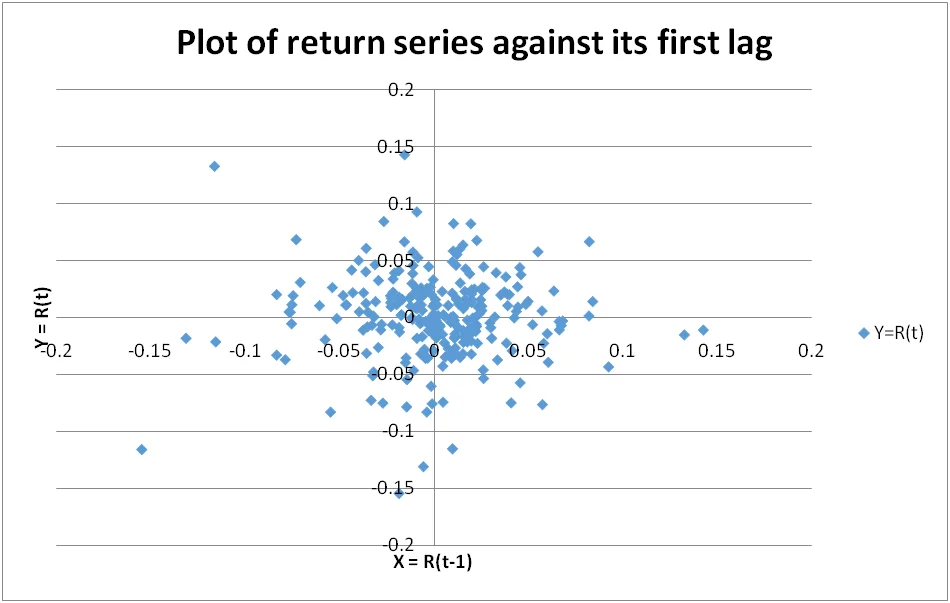
A. Return Model
- Use Excel to create a scatter diagram between this period’s return (Rt) and the previous period’s return (Rt-1).
- Visually assess the linear relationship.
Regression Output:
- Run a regression for your company using return in the current period (Rt) as the dependent variable and return in the previous period (Rt-1) as the independent variable.
- Attach the regression output.
Answer the following:
- What is the estimated regression line?
- Interpret the value of r² and correlation coefficient.
- Is the correlation coefficient significant? Why?
- What is the p-value of the slope? What does it tell you about the regression model?
- If the slope is not significantly different from 0, what are the implications?
B. Price Model
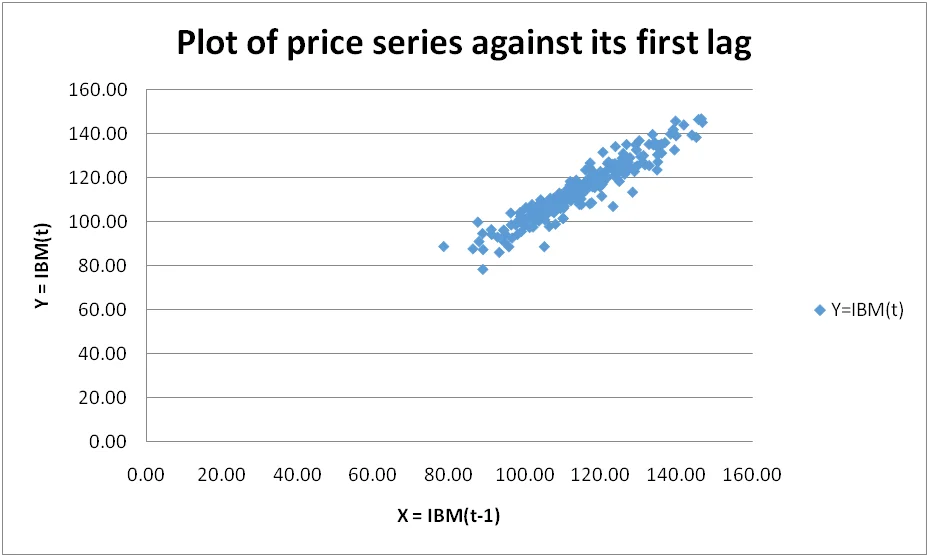
- Create a scatter diagram between this period’s price (Pt) and the previous period’s price (Pt-1).
- Visually assess the linear relationship.
Regression Output:
- Run a regression using the price in the current period (Pt) as the dependent variable and the price in the previous period (Pt-1) as the independent variable.
- Attach the regression output.
Answer the following:
- Write the equation of the estimated regression line.
- Distinguish between the coefficient of determination and the slope.
- What is the p-value of the slope? Is it statistically significant at α = 0.01?
- Find a 95% prediction interval when Pt-1 = average price of the last 5 weeks. Interpret the interval.
C. Market Model
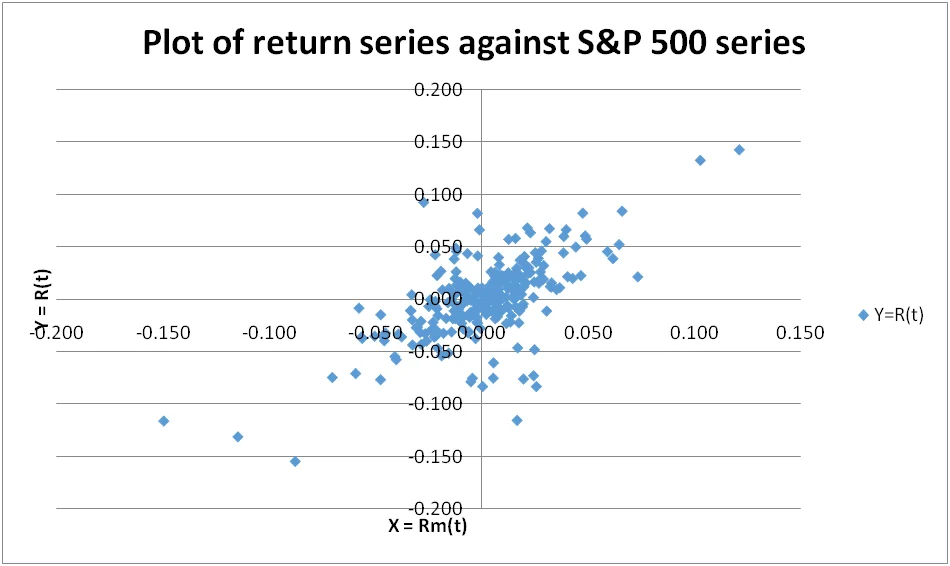
- Construct a scatter diagram between your company’s return (Rt) and the S&P 500 composite index return (Rmt).
- Visually assess the linear relationship.
Regression Output:
- Run a regression using your company’s return in the current period (Rt) as the dependent variable and S&P 500 composite index return in the current period (Rmt) as the independent variable.
- Attach the regression output.
Answer the following:
- Interpret the r² value.
- Interpret the correlation coefficient.
- Write down the regression line. Interpret the value of the slope (beta).
- What is the p-value of the slope? Is the regression model useful?
- Find the 95% confidence interval for Rmt = average market return of the last 5 weeks. Interpret it.
Note: Replace placeholders such as "Your Company" and specific stock symbols with actual details from the analysis.