
Problem Description:
In the context of your Statistical Analysis assignment, we delve into the intricacies of data analysis. In the initial segment, we investigate various data samples, examining their histograms, descriptive statistics, and the ramifications of different sampling techniques. Subsequently, we employ chi-squared tests for hypothesis testing to explore the links between gene expression variations and cancer development, as well as the prevalence of bright coloration in males when natural predators are absent. We are here to assist with your statistical analysis assignment.
Part 1: Exploratory Data Analysis
Subpart 1: Histograms of the Samples
Subpart 2: Distribution Characteristics
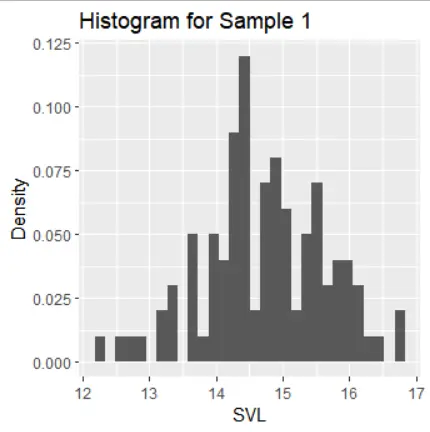
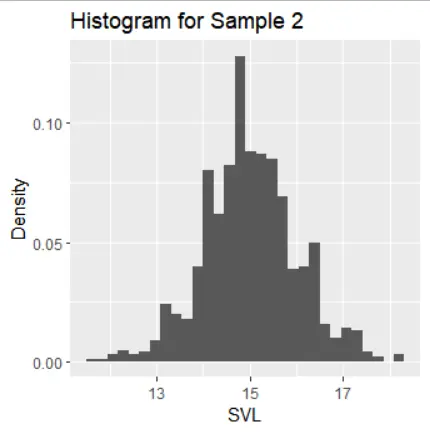
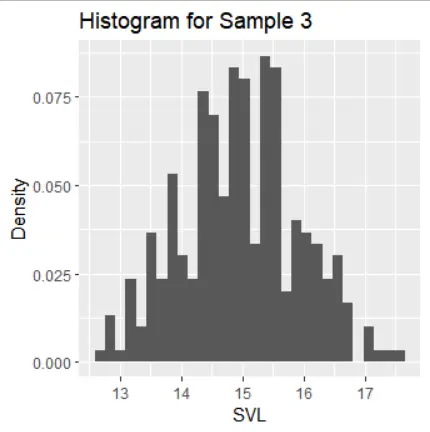
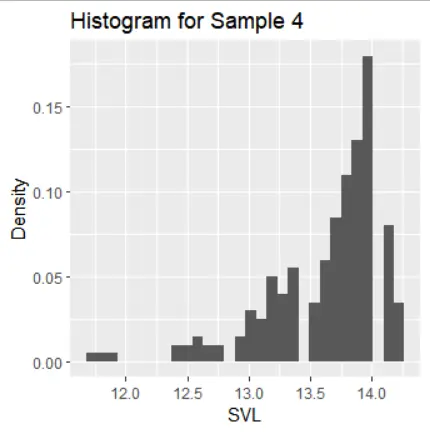
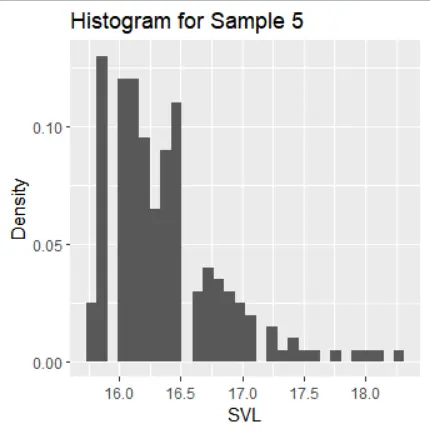
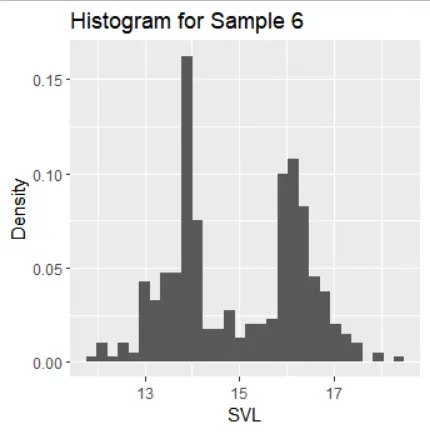
The histograms of the samples show the following distribution characteristics:
- Samples 1, 2, and 3 exhibit normal distribution with one mode and symmetric tails.
- Sample 4 has a left-skewed distribution with one mode.
- Sample 5 has a right-skewed distribution with one mode.
- Sample 6 is symmetric around its mean but has two modes.
Subpart 3: Descriptive Statistics
| Sample | N | Y̅ | S² | S | SE(Y̅) | σ(Y̅) |
|---|---|---|---|---|---|---|
| 1 | 100 | 14.737 | 0.846 | 0.920 | 0.279 | 0.092 |
| 2 | 1000 | 15.006 | 1.000 | 1.000 | 0.032 | 0.032 |
| 3 | 300 | 14.961 | 0.921 | 0.960 | 0.068 | 0.055 |
| 4 | 400 | 13.633 | 0.221 | 0.470 | 1.367 | 0.024 |
| 5 | 400 | 16.376 | 0.217 | 0.466 | 1.376 | 0.023 |
| 6 | 400 | 14.990 | 1.846 | 1.359 | 0.069 | 0.068 |
Subpart 4: Standard Error and Deviation
The standard error of the sample mean is highest for samples 4 and 5, reflecting their biased sampling compared to samples 1-3 and 6. The standard deviation of the sample mean is lowest for samples 3 and 4 due to the concentration of data around the sample mean
Subpart 5: Random Sampling
Sampling of samples 1, 2, and 3 appears random if the population distribution resembles a normal distribution. In contrast, samples 4, 5, and 6 seem to have non-random sampling. When the population is not random, it's challenging to assess sampling, but sample 6 aligns most closely with the population values in terms of mean and standard deviation.
Subpart 6: Boxplot Representation
Using boxplots to compare data across samples is recommended. Boxplots display data quantiles, facilitating comparisons between different samples.
Subpart 7: Boxplot of Sample Variance Levels (SVL)
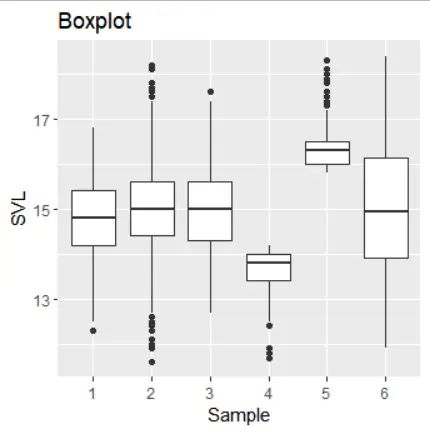
Fig: Boxplot of the SVL
Part 2: Hypothesis Testing
Q1: Differential Expression and Cancer
In this section, we employ a chi-squared test to examine whether differential gene expression is independent of cancer development. The hypothesis is as follows:
- Null Hypothesis (H₀): Differential expression is independent of cancer exposure.
- Alternative Hypothesis (H₁): H₀ is false.
The level of significance is set at 5%. We calculate the chi-squared test statistic, which equals 56.58. With one degree of freedom, the critical value is 3.841.
The p-value is 0, which is less than the significance level. Therefore, we reject the null hypothesis and conclude that differential expressions are associated with cancer exposure.
Q2: Proportion of Males with Bright Coloration
In this test, we examine whether a lack of natural predators has increased the proportion of males with bright coloration on the mainland. The hypothesis is as follows:
- Null Hypothesis (H₀): The proportion of males exhibiting bright coloration on the mainland is 60% (p = 0.6).
- Alternative Hypothesis (H₁): The proportion of males exhibiting bright coloration on the mainland is not 60% (p ≠ 0.6).
The level of significance is 5%. We calculate the chi-squared test statistic as 3.11, which is smaller than the critical value of 3.841.
Thus, we fail to reject the null hypothesis and conclude that 60% of males exhibit bright coloration on the mainland.