
Problem Description:
The data analysis assignment focuses on analyzing various aspects of a dataset to draw meaningful conclusions using statistical tests. It explores relationships between different variables, such as income, race, age, happiness, number of children, education, and more. The goal is to determine statistical significance and associations between these variables.
Part One of the assignment deals with different questions related to the dataset, including:
- Income and TV Watching: The first part examines whether there's a statistically significant difference in average hours of TV watching based on income level. It concludes that there is no significant association between income and TV watching.
- Age and Happiness: This part explores the relationship between age and happiness, concluding that there is a significant association between the two.
- Average TV Watching: It estimates the average number of hours spent watching TV for the entire population.
- Sample Representation: It checks whether the sample, with an average number of children, is representative of the population. The sample is found not to be representative.
- Educational Levels: The assignment tests whether the educational levels of Catholics and Protestants are significantly different, concluding that they are indeed different.
- TV Watching and Happiness: This part examines whether the average hours of TV watching vary by the level of happiness, with a statistical test indicating that they do.
- Proportion of Black Americans: It estimates the proportion of Black Americans in the population, finding it to be approximately 13.5%.
Part Two explores how religious preferences may influence three different variables - political views, support for homosexual rights to marry, and support for women's right to abortion. It concludes that there is a strong association between religious views and these variables using chi-square goodness-of-fit tests.
Restructured Content:
Part One
Question 1: Is there a Statistically Significant Difference in TV Watching by Income and Race?
- To analyze the association between income and TV watching, we performed a correlation test. However, the results were statistically insignificant, indicating no significant connection between income and TV watching.
| Confidence Intervals | ||||
|---|---|---|---|---|
| Hours per day watching tv - Total family income | Pearson Correlation | Sig. (2-tailed) | 95% Confidence Intervals (2-tailed) | |
| Lower | Upper | |||
| Correlation Coefficient | -.034 | .198 | -.086 | .018 |
Table 1: Test of Correlation
- Since race is a categorical variable, we conducted an ANOVA F-test, which also showed an insignificant relationship between race and TV watching.
| ANOVA | |||||
|---|---|---|---|---|---|
| TOTAL FAMILY INCOME | |||||
| Sum of Squares | df | Mean Square | F | Sig. | |
| Between Groups | 3692.189 | 6 | 615.365 | 1.665 | .126 |
| Within Groups | 524516.195 | 1419 | 369.638 | ||
| Total | 528208.384 | 1425 | |||
Table 2: ANOVA F-test
Question 2: Is There a Statistically Significant Relationship Between Age and Happiness?
- Age and happiness were analyzed using an ANOVA F-test. The results were statistically significant, suggesting that age and happiness are indeed related.
| ANOVA | |||||
|---|---|---|---|---|---|
| AGE OF RESPONDENT | |||||
| Sum of Squares | df | Mean Square | F | Sig. | |
| Between Groups | 2843.548 | 3 | 947.849 | 3.061 | .027 |
| Within Groups | 297244.223 | 960 | 309.629 | ||
| Total | 300087.771 | 963 | |||
Table 3: ANOVA F-test
Question 3: Average TV Watching for the Entire Population
- The average hours spent watching TV for the entire population were estimated to be 3 hours per day with a standard deviation of 2.4.
| Descriptive Statistics | |||||
|---|---|---|---|---|---|
| N | Minimum | Maximum | Mean | Std. Deviation | |
| HOURS PER DAY WATCHING TV | 618 | 0 | 24 | 3.00 | 2.404 |
Table 4: Determining Standard Deviation
Question 4: Sample Representation of Americans' Number of Children
- We examined whether the sample, with an average number of children, represents the population. The one-sample t-test revealed a significant difference, indicating that the sample is not representative of the population.
Question 5: Are Educational Levels Different for Catholics and Protestants?
- A two-sample t-test was conducted to determine if the educational levels of Catholics and Protestants differ. The results showed a significant difference between the two groups.
Question 6: Do Average TV Watching Hours Vary by Level of Happiness?
- To assess the relationship between TV watching and happiness, we conducted an ANOVA F-test. The test revealed that average TV watching hours do vary by the level of happiness.
| ANOVA | Sum of Squares | df | Mean Square | F | Sig. |
|---|---|---|---|---|---|
| Between Groups | 2843.548 | 3 | 947.849 | 3.061 | .027 |
| Within Groups | 297244.223 | 960 | 309.629 | ||
| Total | 300087.771 | 963 |
Table 5: ANOVA F-test
| AGE OF RESPONDENT | Mean | Std. Deviation |
|---|---|---|
| VERY HAPPY | 49.60 | 18.083 |
| PRETTY HAPPY | 46.10 | 17.277 |
| NOT TOO HAPPY | 46.96 | 17.584 |
| DK | 58.67 | 19.553 |
| Total | 47.43 | 17.653 |
Question 7: Estimate the Proportion of Black Americans in the Population
- The sample estimate for Black Americans in the population is approximately 13.5%.
Part Two
Variables that May Differ by Religious Preferences:
- Political Views: Religious views can significantly influence political views, with values, beliefs, and moral perspectives playing a role. A chi-square goodness-of-fit test showed a strong association between religious and political views.
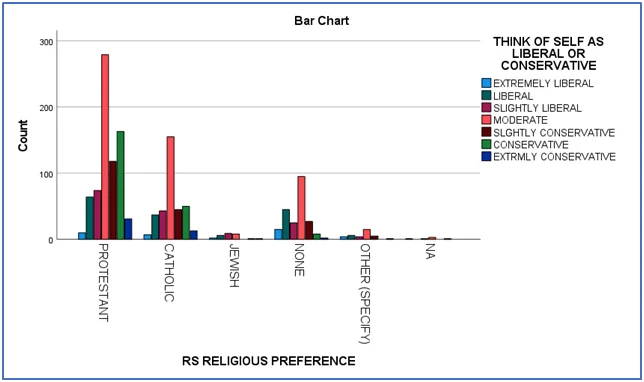
Bar chart 1
- Homosexuals' Right to Marry: Religious views can shape opinions on same-sex marriage. A chi-square test indicated a strong association between religious views and support for homosexual rights to marry.
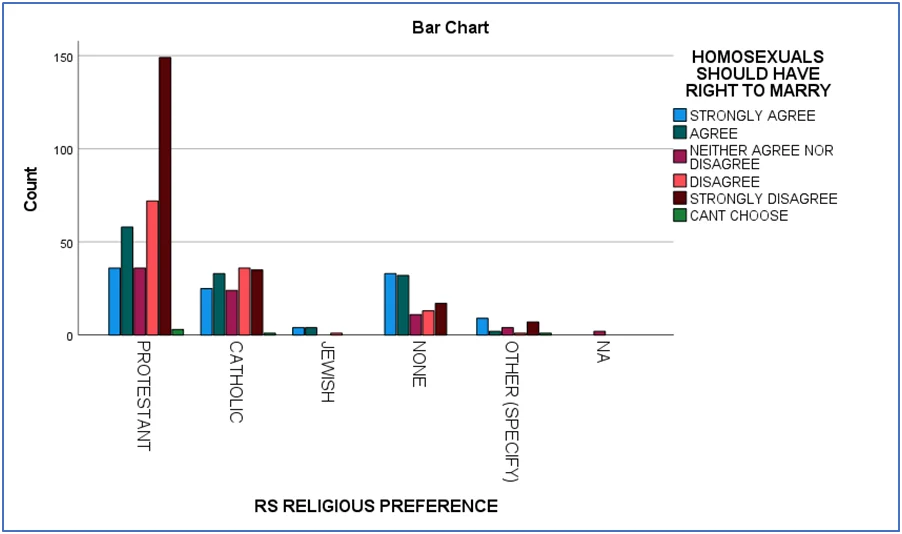
Bar chart 2
- Women's Right to Abortion: Religious views can influence opinions on abortion. A chi-square test revealed a strong association between religious views and support for women's right to abortion.
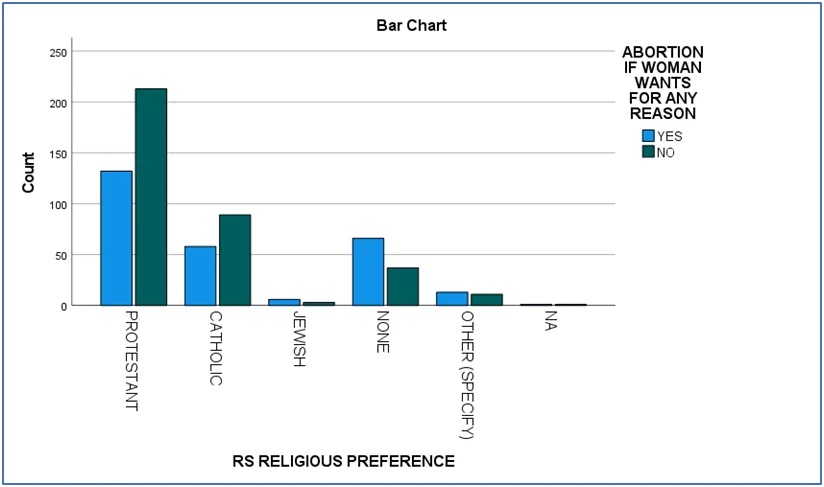
Bar chart 3