
Problem Description
In the Probability assignment, we are tasked with analyzing the sampling distribution of a certain population with a mean of 40.9 points and a standard deviation of 11.9. We want to find the probability of obtaining a sample mean greater than 44, denoted as P(X̅ > 44), and we will use the z-score and the normal distribution table to calculate it. Additionally, we will illustrate how changing the sample size affects this probability and provide an explanation for the observed results.
Solution 1:
- Given that the standard error (se) of the sample mean is calculated as se = σ / √n, where n is the sample size.
- For our first scenario, the standard deviation if the sample mean is given as: se=σ/√n=11.9/√50=1.683
We need to find the probability P(X̅ > 44), which we can calculate as follows:
- Convert the problem into a z-score problem: P(X ̅>44)=P((X ̅-50)/1.683>(44-50)/1.683)=P(Z>-6/1.683)=P(Z>-3.57)=1-P(Z<-3.57)=0.9998
- Look up the z-score in the normal distribution table: P(Z > -3.57) ≈ 0.9998
Illustration 1
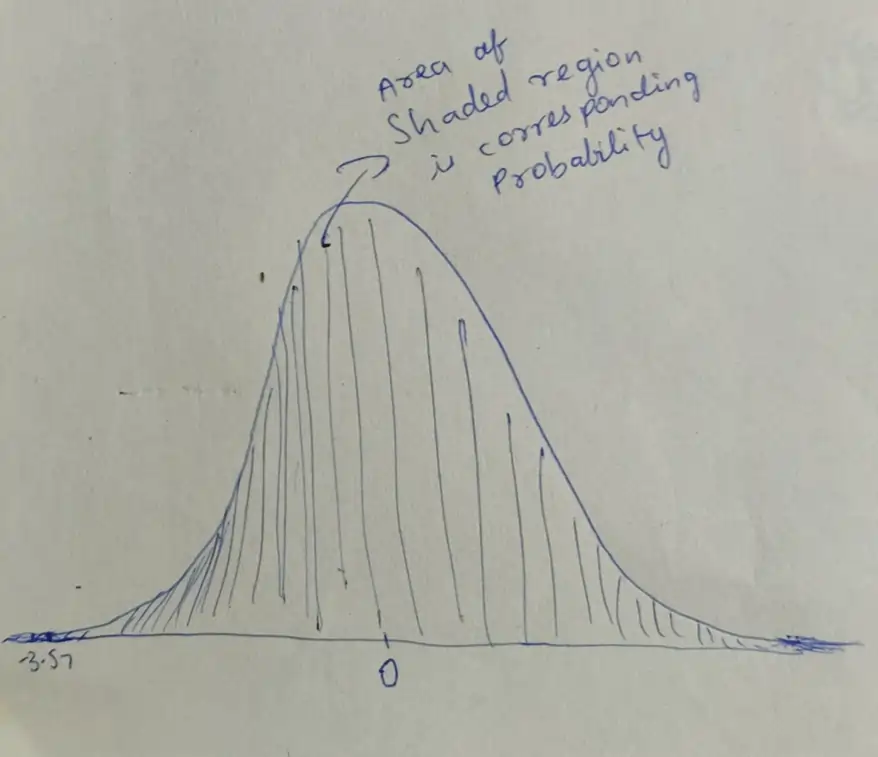
Fig 1: Sampling distribution for scenario 1
For our initial scenario, it's evident that the shape of the sampling distribution is normal, with a mean (μ) consistent with the population mean (40.9 points). With a sample size of 50, the standard error (se) is approximately 1.683. We find that the probability of obtaining a sample mean (X̅) greater than 44 is close to 0.9998.
Solution 2:
- In this second scenario, we alter the sample size to n = 100, resulting in a new standard error of se=σ/√n=11.9/√100=1.19
We aim to find the probability P(X̅ > 44) using the z-score method:
a) We need to find the probability P(X ̅>44). We can find this using z-score and normal distribution table: P(X ̅>44)=P((X ̅-50)/1.19>(44-50)/1.19)=P(Z>-6/1.19)=P(Z>-5.04)=1-P(Z<-3.57)=1
Illustration 2
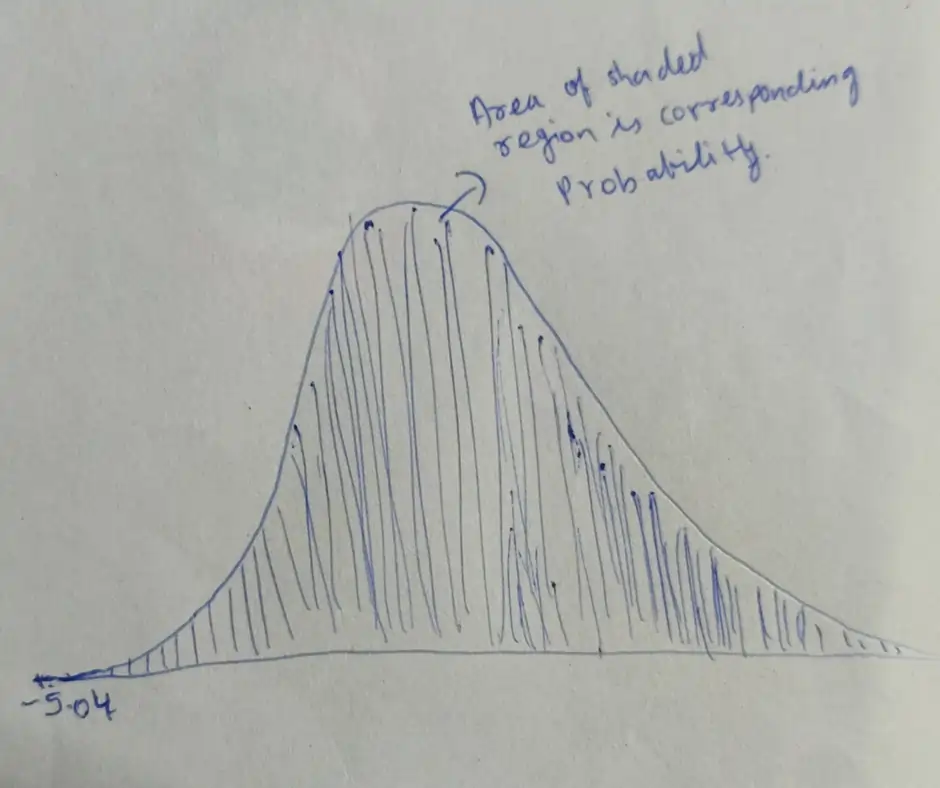
Fig 2: Sampling distribution for scenario 2
For this altered scenario with a sample size of 100, the shape of the sampling distribution remains normal, with a mean (μ) in line with the population mean (40.9 points). The standard error (se) is approximately 1.19. In this case, the probability of obtaining a sample mean (X̅) greater than 44 is 1, indicating that it is highly likely.
Explanation: Comparing the two scenarios, we observe that as the sample size increases, the standard error (se) decreases. Consequently, the probability of obtaining a sample mean that deviates significantly from the population mean decreases. This leads to a smaller probability of P(X̅ < 44) and, conversely, a higher probability of P(X̅ > 44). Therefore, it becomes more likely to obtain a sample mean greater than 44 as the sample size increases.
This demonstrates the importance of sample size in influencing the reliability and predictability of sample means in relation to the population mean.