
Problem Description
Despite global concerns about students' declining performance in mathematics and science, there is a pressing need to investigate the role of reading proficiency in data analysis assignment. The study seeks to address whether students' reading abilities significantly impact their achievements in mathematics and science. Analyzing PISA data and applying statistical methods, we aim to uncover the relationship between reading skills and scholastic performance, offering insights for educational improvements worldwide.
Introduction
Education systems worldwide have been grappling with students' underwhelming results in mathematics and science exams over the past decade. Recent research suggests that reading comprehension can play a vital role in improving students' performance in these subjects. To address this issue, innovative teaching strategies are needed. The Program for International Student Assessment (PISA) conducted by the Organization for Economic Co-operation and Development (OECD) provides valuable data to explore the impact of reading abilities on students' mathematics and science scores. In this study, we aim to investigate how students' reading performance influences their achievements in mathematics and science.
Aim and Research Questions
Research questions:
- Is there a significant difference in the average reading performance between male and female students?
- Do students' reading performance, mathematics scores, and science scores significantly differ?
- Does students' reading performance significantly affect their mathematics performance?
Descriptive Statistics
We utilized four main variables from the PISA dataset to summarize our findings:
- Math score
- Minimum: 261.12
- Maximum: 727.45
- Mean: 492.44
- Median: 493.42
- Standard deviation: 83.80
- Science score
- Minimum: 253.60
- Maximum: 786.08
- Mean: 512.14
- Median: 514.08
- Standard deviation: 93.86
- Reading Performance
- Minimum: 222.50
- Maximum: 795.86
- Mean: 516.65
- Median: 519.50
- Standard deviation: 100.79
Furthermore, we looked at the distribution of students by gender:
- Gender
- Female: 496 (49.6%)
- Male: 504 (50.4%)
Hypotheses
To address our research questions, we tested the following hypotheses:
- Null Hypothesis 1: There is no significant difference in average reading performance between male and female students.
- Alternative Hypothesis 1: There is a significant difference in average reading performance between male and female students.
- Null Hypothesis 2: There is no significant difference between students' average reading performance, math scores, and science scores.
- Alternative Hypothesis 2: There is a significant difference between students' average reading performance, math scores, and science scores.
- Null Hypothesis 3: There is no significant linear relationship between students' mathematics scores and their reading performance, gender, attitude toward school, subjective well-being, and perception of the difficulty of the PISA test.
- Alternative Hypothesis 3: There is a significant linear relationship between students' mathematics scores and their reading performance, gender, attitude toward school, subjective well-being, and perception of the difficulty of the PISA test.
Inferential Statistics
We performed an independent t-test to investigate the difference in average reading performance between male and female students. The results showed a significant difference (p = .002) in average reading performance between the two genders.
| |
SEX | 95% CI | ||||
|---|---|---|---|---|---|---|
| Male | Female | t | df | Lower | Upper | |
| Reading Performance | 506.92 (102.93) |
526.53 (97.68) |
3.09 | 998 | 7.149 | 32.060 |
- Table 1: Comparison of students’ average reading performance between gender
An ANOVA was conducted to explore the differences in students' average reading performance, math scores, and science scores. The results revealed a significant difference (p < .001) between the groups. Post-hoc tests showed that students' reading and science scores belonged to one homogeneous group, while math scores formed another group.
| Performance | Sum of Squares | df | Mean Square | F | p-value |
|---|---|---|---|---|---|
| Between Groups | 331430.302 | 2 | 165715.151 | 19.127 | .000 |
| Within Groups | 25965285.577 | 2997 | 8663.759 | ||
| Total | 26296715.878 | 2999 |
- Table 2: Comparison of students’ average reading performance, math scores, and science scores
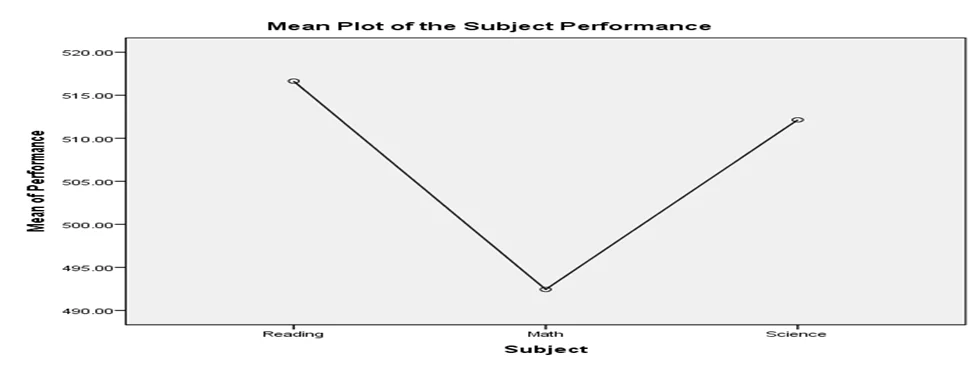
- Figure 1: Mean plot of the students’ subject performance.
Multiple linear regression was employed to examine the impact of reading performance on students' mathematics scores. The results indicated a strong positive relationship between reading performance and math scores. Moreover, gender significantly affected mathematics scores, while attitude toward school, subjective well-being, and perception of the PISA test's difficulty did not.
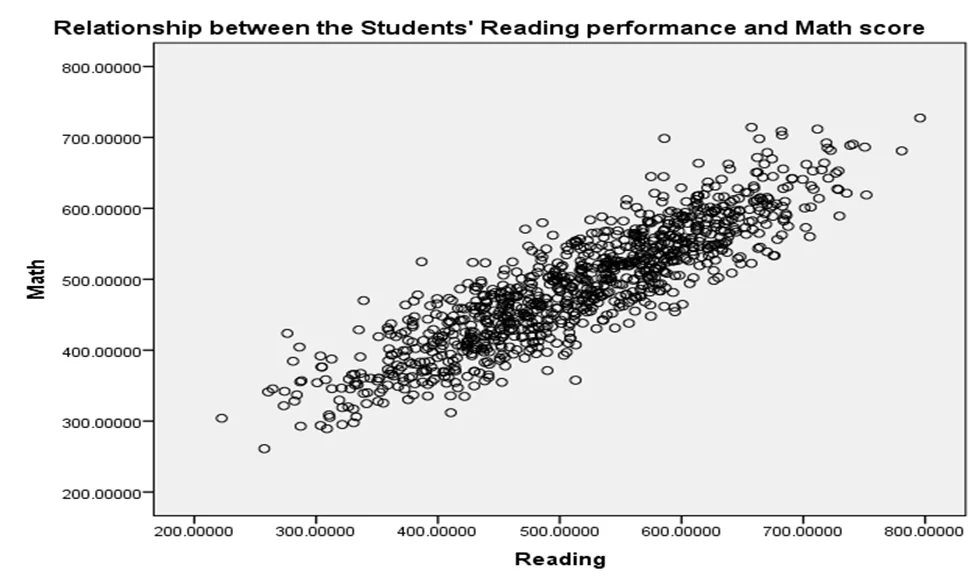
- Figure 2: Scatter plot of the relationship between the student's reading performance and math score
The scatter plot indicated a strong positive relationship between the student's reading performance and math score. The table below showed the summary of the regression results;
| Variables | Coefficient | Std. Error | t-value | p-value |
|---|---|---|---|---|
| (Constant) | 71.089 | 14.797 | 4.804 | .000 |
| Reading | .753 | .013 | 57.151 | .000 |
| Sex | 26.859 | 2.369 | 11.338 | .000 |
| Attitude | -.903 | .547 | -1.650 | .099 |
| Well_being | -.031 | .627 | -.049 | .961 |
| Difficulty | .318 | .663 | .479 | .632 |
F-value = 839.87, p<0.001, R-square = 0.809
The F-value in the ANOVA table tests whether the overall regression model is a good fit for the data. The table showed a significant linear relationship between the students' mathematics scores and their reading performance, gender, attitude towards school, subjective well-being, and perception of the difficulty of the PISA test [F (5, 994) = 839.87, p < .001]. The model is significant.
Conclusion
This study delved into the relationship between students' reading performance and their achievements in mathematics and science. The analysis of PISA data revealed significant differences in reading performance between genders and among subjects. It also showed that reading performance strongly influences mathematics scores. These findings emphasize the importance of reading comprehension in enhancing students' scholastic performance in mathematics and science, providing valuable insights for educators and policymakers.