
Problem Description:
The Rapid Miner assignment aimed to leverage Rapid Miner for association analysis to uncover valuable insights into consumer behavior, market trends, and potential cross-selling opportunities within a dataset of various products. The goal was to strategically determine product placement in a grocery store's food section to optimize sales.
Insights from Association Analysis:
Figure 1: Product Associations
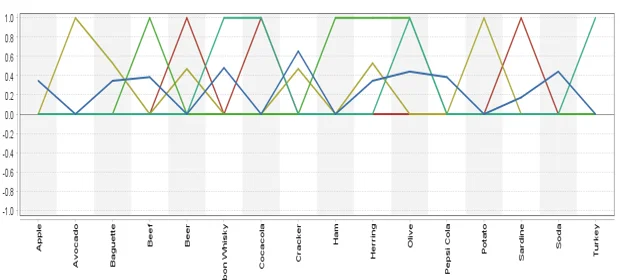
Figure 1: Product Associations
In Figure 1, a cluster of products, including avocado, beer, Bourbon Whiskey, Coca-Cola, ham, herring, olive, potato, sardine, and turkey, exhibits a strong positive association. Their frequent co-occurrence suggests consistent patterns of consumer preferences. This information provides a foundation for understanding potential relationships and connections between specific products.
Table 1: Insights for Soda Product Placement
| Cluster | Avoc... 1 | Baguette | Beef | Beer | Burbon - | Cocacola | Cracker | Herring | Olive | Pepsi C... | Potato | Sardine | Turkey |
|---|---|---|---|---|---|---|---|---|---|---|---|---|---|
| Cluster 1 | 0 | 0 | 0.429 | 0.143 | 0.714 | 0.429 | 0.429 | 0.143 | 0.571 | 0.286 | 0 | 0.143 | 0.286 |
| Cluster 0 | 0.667 | 0.667 | 0 | 0.333 | 0 | 0 | 0.333 | 0.333 | 0 | 0.333 | 0.667 | 0.333 | 0 |
Regarding the question of suitable products to display alongside soda, Table 1 highlights insights from Cluster 1 and Cluster 0. Bourbon Whiskey and olive in Cluster 1, and avocado, baguette, and potato in Cluster 0, show strong positive associations. These findings offer strategic guidance for product placement to potentially increase sales in the grocery store's food section.
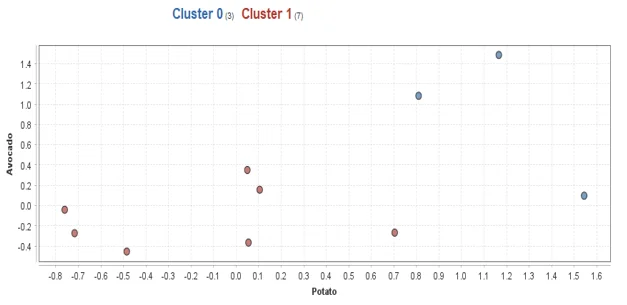
Table 2: Correlation Coefficients
Table 2 reveals correlation coefficients, emphasizing the pair with the highest positive correlation—Turkey and Coca-Cola (0.764). This suggests a strategic advantage in promoting the sale of these items together. However, negative correlations, such as Olive and Pepsi, indicate inverse relationships. Careful evaluation of negative correlations is essential for understanding potential conflicts or substitution patterns.
Table 3: Negative Correlations
| Attribut | Avocado | Baguette | Beef | Beer | Burbon. | Cocacola | Cracker | Herring | Olive | Pepsi C... | Potato | Sardine | Turkey |
|---|---|---|---|---|---|---|---|---|---|---|---|---|---|
| Avocado | 1 | 0.375 | -0.327 | 0.375 | -0.500 | -0.327 | 0.102 | 0.375 | -0.408 | -0.327 | 1 | -0.250 | -0.250 |
| Baguette | 0.375 | 1 | -0.327 | -0.250 | -0.500 | -0.327 | -0.408 | 0.375 | -0.408 | 0.218 | 0.375 | 0.375 | -0.250 |
| -0.327 | -0.327 | -0.327 | 0.218 | -0.429 | 0.356 | 0.218 | -0.089 | 0.524 | -0.327 | -0.327 | -0.327 | ||
| Beer | 0.375 | -0.250 | -0.327 | 1 | -0.500 | 0.218 | 0.102 | -0.250 | -0.408 | -0.327 | 0.375 | 0.375 | -0.250 |
| Burbon-0.500 | -0.500 | 0.218 | -0.500 | 1 | 0.218 | 0.408 | -0.500 | 0.408 | 0.218 | -0.500 | -0.500 | 0.500 | |
| Cocacola | -0.327 | -0.327 | -0.429 | 0.218 | 0.218 | 1 | -0.535 | -0.327 | 0.356 | -0.429 | -0.327 | 0.218 | 0.764 |
| Cracker | 0.102 | -0.408 | 0.356 | 0.102 | 0.408 | -0.535 | 1 | -0.408 | -0.250 | 0.356 | 0.102 | -0.408 | |
| Attribut... | Avocado | Baguette | Beef | Beer | Burbon... | Cocacola | Cracker | Herring | Olive | Pepsi C.. | Potato | Sardine | Turkey |
|---|---|---|---|---|---|---|---|---|---|---|---|---|---|
| Cracker | 0.102 | -0.408 | 0.356 | 0.102 | 0.408 | -0.535 | 1 | -0.408 | -0.250 | 0.356 | 0.102 | -0.408 | -0.408 |
| Herring | 0.375 | 0.375 | 0.218 | -0.250 | -0.500 | -0.327 | -0.408 | 1 | 0.102 | -0.327 | 0.375 | -0.250 | -0.250 |
| Olive | -0.408 | -0.408 | -0.089 | -0.408 | 0.408 | 0.356 | -0.250 | 0.102 | 1 | -0.535 | -0.408 | -0.408 | 0.612 |
| Pepsi C... | -0.327 | 0.218 | 0.524 | -0.327 | 0218 | -0.429 | 0.356 | -0.327 | -0.535 | 1 | 0.218 | -0.327 | |
| Potato | 1 | 0.375 | -0.327 | 0.375 | -0.500 | -0.327 | 0.102 | 0.375 | -0.408 | -0.327 | 1 | -0.250 | -0.250 |
| Sardine | -0.250 | 0.375 | -0.327 | 0.375 | -0.500 | 0218 | -0.408 | -0.250 | -0.408 | 0.218 | -0.250 | 1 | -0.250 |
| Turkey | -0.250 | -0.250 | -0.327 | -0.250 | 0.500 | 0.764 | -0.408 | -0.250 | 0.612 | -0.327 | -0.250 | -0.250 | 1 |
Table 3 further explores negative correlations, providing crucial information for decision-making. For instance, the negative correlation between Olive and Pepsi signals a potential conflict in sales. Understanding these correlations allows the purchasing manager to make informed choices in optimizing product layout, ensuring maximum sales and customer satisfaction.
By combining insights from association analysis and correlation coefficients, the purchasing manager can develop a nuanced product placement strategy, maximizing positive associations and addressing potential conflicts for an optimized sales approach in the grocery store's food section.