
Problem Statement
This ANOVA assignment involves analyzing a dataset containing Monkeypox infection data. Based on 80 subjects, the task is to assess data distribution, measures of central tendency and spread. It includes frequency and contingency tables for Monkeypox and vaccine categories. The relationship between weight and age is examined, and an estimation of population parameters for female height is considered. Additionally, the correlation between BMI and Monkeypox categories is analyzed. The goal is to gain insights into the dataset using ANOVA testing in StatCrunch, uncovering meaningful patterns and associations.
Q1. Analyzing Data Distribution and Measures of Central Tendency
After examining the dataset, complete the following table:
| Variable Name | Variable Description | Classification (Categorical vs Continuous/Quantitative) | Appropriate Graph to Display Data | Appropriate Summary/Descriptive Statistics |
|---|---|---|---|---|
| Weight (Wt) | Weight in pounds | Quantitative | Stemplot/Histogram | Mean/SD |
| Height (Ht) | Height in inches | Quantitative | Stemplot/Histogram | Mean/SD |
| BMI | BMI values | Quantitative | Stemplot/Histogram | Median/IQR |
| BMI and Gender | BMI values, Gender (F/M) | Gender: Categorical, BMI: Continuous | Boxplot | Mean and SD |
| Monkeypox and Vaccine Categories | Monkeypox categories, Vaccine Categories (1 = BioNTech & Pfizer, 2 = Moderna, 3 = Johnson & Johnson) | Both Categorical | Two-Way Table | Conditional Percentage |
Table 1: Analyzing Data Distribution and Measures of Central Tendency
Assess the distribution of the following variables: Age, Height, Weight, and BMI. Based on the distribution, which measures of central tendency and spread are appropriate for each variable (mean vs median, etc.)? Why?
Based on the histograms displayed below, all variables except BMI are roughly normally distributed. BMI is right-skewed, while Age, Height, and Weight have symmetrical distributions. The appropriate measures of central tendency and spread are as follows:
- For normally distributed variables (Age, Height, Weight): Mean (for central tendency) and Standard Deviation (for spread).
- For the skewed variable (BMI): Median (for central tendency) and Interquartile Range (IQR) (for spread).
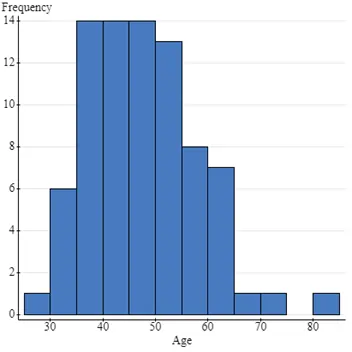
Fig1: Frequency and Age Bar Graph
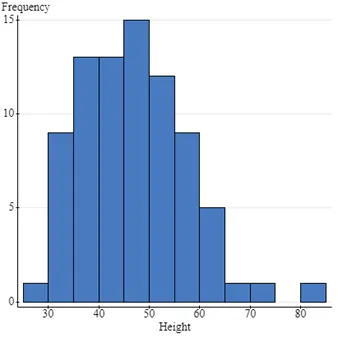
Fig 2: Frequency and Height Bar Graph
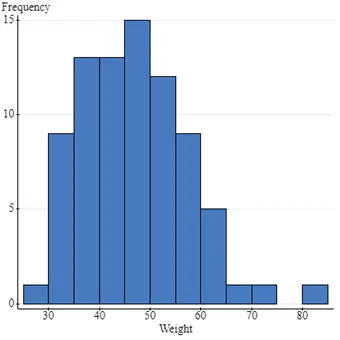
Fig 3: Frequency and Weight Bar Graph
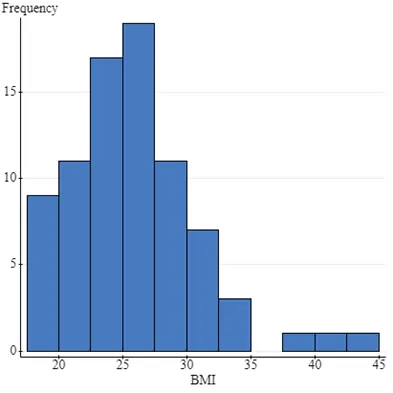
Fig 4: Frequency and BMI Bar Graph
Q2. Frequency and Contingency Tables for Monkeypox and Vaccine Categories
Frequency table results for Monkeypox:
| Monkeypox | Frequency | Percent of Total |
|---|---|---|
| 1 | 48 | 60 |
| 2 | 32 | 40 |
Table 2: Frequency table results for Monkeypox:
- Count = 80
- Monkeypox:
- 1: 48 (60%)
- 2: 32 (40%)
Frequency table results for Vaccine:
| Vaccine | Frequency | Percent of Total |
|---|---|---|
| 1 | 37 | 46.25 |
| 2 | 30 | 37.5 |
| 3 | 13 | 16.25 |
Table 3: Frequency table results for Vaccine:
- Count = 80
- Vaccine:
- 1: 37 (46.25%)
- 2: 30 (37.5%)
- 3: 13 (16.25%)
Contingency table results:
Rows: Vaccine Columns: Monkeypox
| Monkeypox Categories | ||
|---|---|---|
| Vaccine Categories | Negative | Positive |
| 1 | 36 (97.3%) | 1 (2.7%) |
| 2 | 12 (40%) | 18 (60%) |
| 3 | 0 (0%) | 13 (100%) |
Table 4: Contingency table results:
Based on the contingency table above, Monkeypox is the response variable, and Vaccine is the explanatory variable.
Q3. Analyzing the Relationship Between Weight and Age
- Show the relationship between weight and age using an appropriate graph.
- Report the summary statistics that summarize the magnitude and direction of the relationships.
The correlation between Weight and Age is 1, indicating a perfect, linear, and positive relationship between Age and Weight. This pattern holds for both male and female participants, signifying a perfect, linear, and positive relationship for each gender.
Fig 5: relationship between weight and age
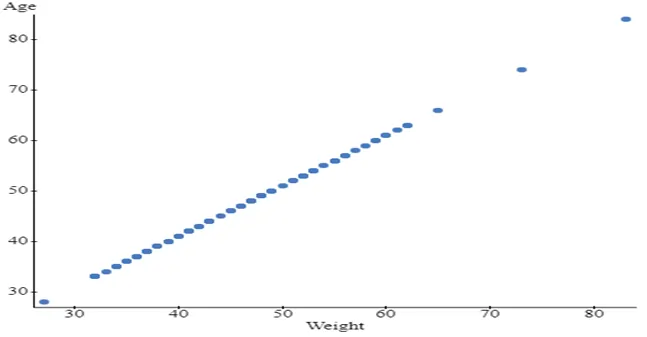
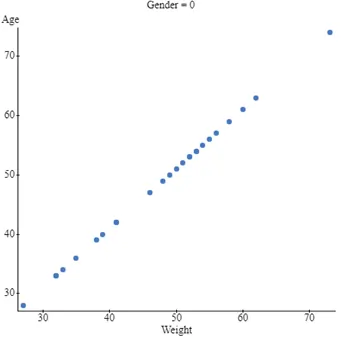

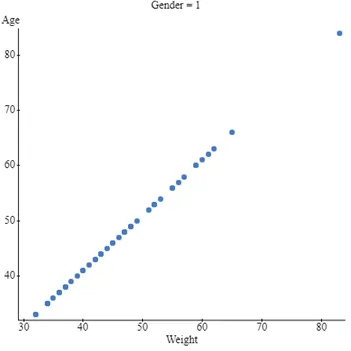
Fig 6: relationship between weight and age for females and males
Q4. Estimating Population Parameter for Female Height
Based on population data, the average American female height (for adults) is 64 inches with a standard deviation of 3. Do the sample statistics from the dataset provide a likely estimate of the population parameter μ (for females) in the United States? What range of values would you expect for the sample mean given the population parameter and a sample size of 50?
Solution: Given information:
- Sample size (n) = 50
- Population mean (μ) = 64
- Population standard deviation (σ) = 3
- Sample mean (x̅) = 46.76
The standard error for the sample mean is calculated as: se = (σ) / √n = (3) / √50 ≈ 0.4243
Since 99.7% of data values lie within 3 standard deviations of the mean, the possible range for the sample mean is: μ ± 3se = 64 ± 3 * 0.4243 ≈ (62.74, 65.26)
Analyzing the Relationship Between BMI and Monkeypox Categories
- Present summary statistics for BMI by Monkeypox categories.
- Describe the graph: There is no linear relationship between BMI and Monkeypox.
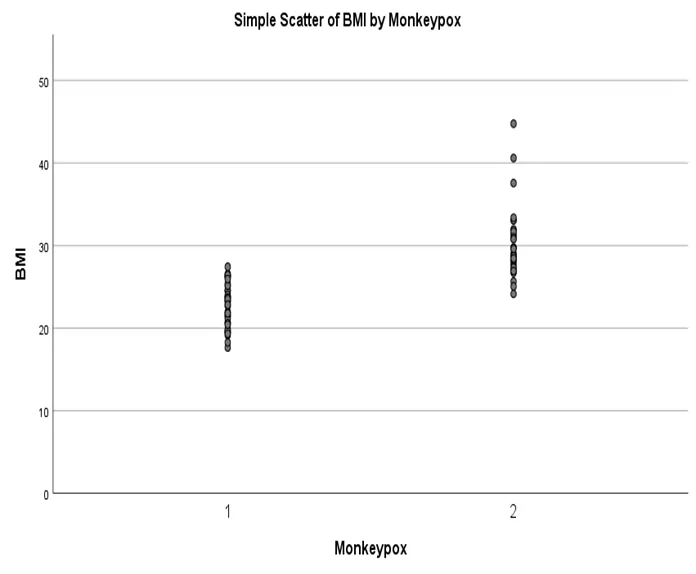
Fig 7: simple scatter plot of BMI by Moneypox