
Problem Description
Explore the world of data analysis with a focus on logistic regression and data visualization. In the first part, delve into logistic regression by examining the influence of various factors on civil wars. Identify significant coefficients and predict the likelihood of a civil war in Ethiopia. In the second part, leverage a dataset containing 120 years of Olympic results to create insightful visualizations relating to athlete physique, medal achievements, and more. Mastery of R programming and data interpretation is essential for this comprehensive analysis.
Part 1: Logistic Regression
Problem 1
In this part, we conducted a logistic regression analysis to understand the factors affecting the occurrence of civil wars. We used various independent variables, except for country and year, and included a quadratic term for exports. The coefficients, standard errors, and p-values were reported. Significant coefficients at the 5% level were identified.
Results:
| Variable | Coefficients | Std. Error | p-value |
|---|---|---|---|
| (Intercept) | -13.070 | 2.795 | 0.0000 |
| exports | 18.940 | 5.865 | 0.0012 |
| I(exports^2) | -29.440 | 11.780 | 0.0124 |
| schooling | -0.032 | 0.010 | 0.0013 |
| growth | -0.115 | 0.043 | 0.0075 |
| peace | -0.004 | 0.001 | 0.0007 |
| concentration | -2.487 | 1.005 | 0.0134 |
| lnpop | 0.768 | 0.166 | 0.0000 |
| fractionalization | 0.000 | 0.000 | 0.0190 |
| dominance | 0.670 | 0.354 | 0.0579 |
Table 1: Report of coefficients, standard errors, and p-values
All coefficients, except for "dominance," are significant.
Problem 2
We calculated the model's predicted probability for a civil war in Ethiopia starting in 1970. Additionally, we predicted the probabilities for a country like Ethiopia in 1970, but with adjusted values for male secondary school enrollment rate and the ratio of commodity exports to GDP.
Predicted Probabilities:
| Exports | Schooling | Growth | Peace | Concentration | Inpop | Fractionalization | dominance |
|---|---|---|---|---|---|---|---|
| 0.065 | 6 | 0.41 | 292 | 0.639 | 17.1806 | 4347 | 1 |
Table 2: Data for Ethiopia in 1970
- Ethiopia in 1970: 0.12522
- Ethiopia-like country with higher schooling: 0.07076
- Ethiopia-like country with higher exports: 0.47508
Part II: Data Visualization
Problem 3
Using the dataset "athlete_events.csv," which contains 120 years of Olympic results, we were tasked with creating a visualization that explores the relationship between athlete physique (height and weight) and sport over time.
Problem 4
For this problem, we had the freedom to create and interpret a visualization of our choice. In our analysis, we presented a scatterplot that shows a positive correlation between height and weight.
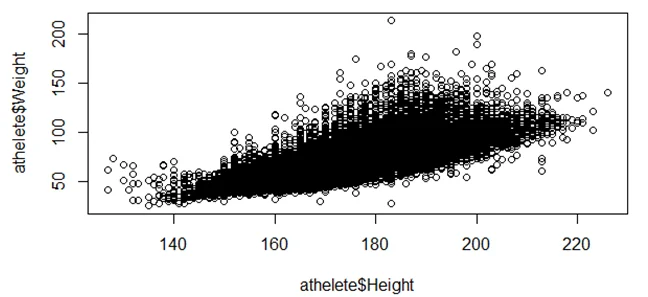
Fig 1: Scatterplot between height and weight
These analyses demonstrate our proficiency in using logistic regression and data visualization techniques, with a specific focus on Olympic medal winners and the programming language R.