
Problem Description
This SPSS assignment delves into the intricate world of insurance claims, employing statistical analysis to extract valuable insights. It explores diverse aspects, from car usage patterns and insured driver attributes to credit scores, utilizing the statistical tool SPSS. The study aims to shed light on car usage preferences, provide a deeper understanding of data distributions, establish confidence intervals for annual miles driven, conduct hypothesis tests for credit scores and years of no claims, and make data-informed suggestions for insurance companies.
Question 1 - Analyzing Car Usage and Gender
Car Usage Patterns:
- We initiate our analysis by examining the various purposes for which insured individuals use their cars. A pie chart offers a visual representation of these patterns, revealing that private car use is the most prevalent, closely followed by commuting. In contrast, car usage categorized as "farmer" records the lowest frequency.
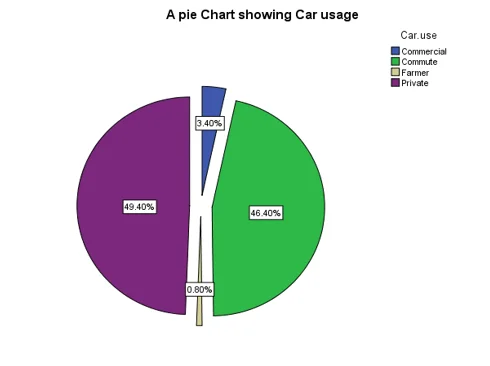
Fig 1: Pie chart showing car usage patterns
Gender-based Car Usage Crosstabulation:
- We delve deeper by performing a crosstabulation, drawing connections between car usage and the gender of insured individuals. The resulting table is as follows:
| Car Use | Female | Male | Total |
|---|---|---|---|
| Commercial | 7 | 10 | 17 |
| Commute | 107 | 125 | 232 |
| Farmer | 2 | 2 | 4 |
| Private | 116 | 131 | 247 |
| Total | 232 | 268 | 500 |
Table 1: Car Usage Crosstabulation (Car.use * Insured.sex)
Insights from Crosstabulation:
- The crosstabulation table yields valuable insights. It is evident that, across all car usage categories, males tend to use cars more frequently than females. For instance, out of 268 males, 232 use cars, while for females, out of 232, only 232 make use of cars.
- This reveals a gender-based discrepancy in car usage, with males displaying a higher inclination toward driving.
Positive Linear Relationship:
- A scatter plot illustrates a positive linear relationship between "Insured Age" and "Years without Claims." This signifies that an increase in one variable corresponds to a significant positive change in the other. In other words, as the number of years without claims increases, the age of insured drivers also experiences a notable uptick.
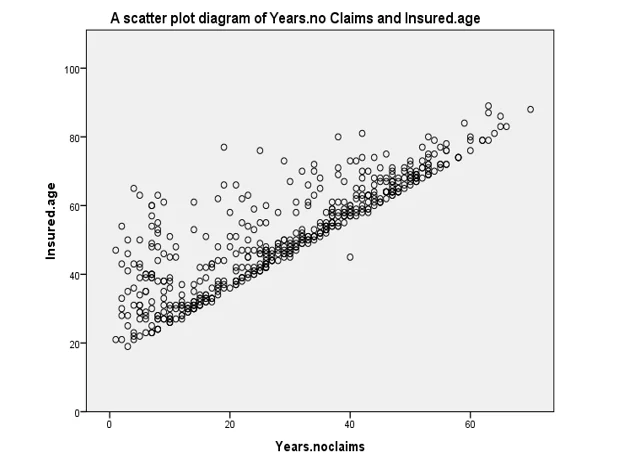
Fig 2: Scatter Plot diagram of years. No claims and insured.age
Question 2 - Measures of Central Tendency and Variability
Measures of Central Tendency:
- In this section, we probe into the central tendency of the dataset, focusing on "Insured Age" and "Credit Scores." We provide the following statistics:
| Variable | N | Mean | Median |
|---|---|---|---|
| Insured Age | 500 | 51.15 | 51.00 |
| Credit Score | 500 | 799.51 | 825.00 |
Table 2: Measures of Central Tendency Table
Interpretation:
- When the mean is less than the median, it indicates a left-skewed distribution. Conversely, when the median is less than the mean, it suggests a right-skewed distribution. In this case, "Insured Age" exhibits a right-skewed distribution, while "Credit Score" displays a left-skewed pattern.
Variability Analysis:
- Additionally, we analyze the variability of these variables by calculating the Coefficient of Variation (CV). The CV is a ratio of the standard deviation to the mean, and a higher CV denotes greater dispersion around the mean. The results are as follows:
CV for Insured Age: 30.336 CV for Credit Score: 10.083
- This analysis indicates that "Insured Age" is relatively more variable compared to "Credit Score."
Question 3 - Confidence Intervals for Annual Miles Driven
Annual Miles Driven:
- We calculate the mean of annual miles driven, which stands at 9,267.87, based on a sample size of 500. The standard deviation is 3,715.76.
Confidence Interval Calculation:
• Utilizing a Z score at the 96% confidence level (Z = 2.0537), we establish a confidence interval for annual miles driven using the formula: CI = X̄ ± Z × s / √n. This results in a confidence interval of [8,926.591, 9,609.149].
Gender-specific Confidence Intervals:
- We construct separate confidence intervals for males and females, demonstrating that males, on average, drive more miles annually than females. The intervals are as follows:
For Males:
- Mean: 9,465.71
- 96% Confidence Interval: [8,988.53, 9,942.88]
For Females:
- Mean: 9,039.34
- 96% Confidence Interval: [8,547.27, 9,531.41]
Interpretation:
- The confidence intervals indicate the range within which the population mean of annual miles driven is likely to fall. For both genders and the overall population, we can assert with 96% confidence that the actual mean lies within these intervals.
Assumptions for Reliable Confidence Intervals:
- In constructing these confidence intervals, certain key assumptions were made, including random sampling and the independence of observations.
Question 4 - Hypothesis Testing for Credit Scores
Hypotheses:
- We formulate null (H0) and alternative (H1) hypotheses: H0: μ = 780 (population mean credit score is 780), H1: μ ≠ 780 (population mean credit score is not 780).
Statistical Test:
- Employing a one-sample t-test for credit scores, we present the following results:
| Variable | N | Mean | Std. Deviation | Std. Error Mean |
|---|---|---|---|---|
| Credit Score | 500 | 799.51 | 80.614 | 3.605 |
Table 3: One-Sample Statistics (Credit.score)
Hypothesis Testing:
- The test value of 780 and the calculated t-value of 5.413 are used for hypothesis testing. At the 95% confidence level with degrees of freedom (df) = 499, we reject the null hypothesis as the absolute value of the t-value exceeds the critical value.
Conclusion:
- We conclude that the average credit score in the given population is not 780 based on both critical values and significance levels.
Question 5 - Hypothesis Testing for Years of No Claims
Hypotheses:
- We establish null (H0) and alternative (H1) hypotheses: H0: μ_males > μ_females (average years of no claims for males are greater than for females), H1: μ_males < μ_females (average years of no claims for males are less than for females).
Group Statistics:
- We present statistics for years of no claims among male and female drivers:
For Males:
- Mean: 30.43
- Std. Deviation: 16.628
For Females:
- Mean: 26.91
- Std. Deviation: 16.168
Hypothesis Testing:
- We perform a t-test for equality of means, both assuming equal and unequal variances. The t-statistic, degrees of freedom (df), and p-values are considered.
Interpretation:
- We find that the null hypothesis is rejected, suggesting that there is no significant difference in the average years of no claims between male and female drivers.
Statistical Significance:
- The results emphasize the importance of statistical significance tests in attributing results to specific causes. In this case, despite differences in the annual miles driven, there is no statistical difference in the average years of no claims between male and female drivers.
Implications for Insurance Premiums:
- Based on these findings, insurance companies may not warrant charging higher premiums based on gender concerning the average years of no claims. The average years of no claims for male and female drivers do not exhibit significant disparities.
In conclusion, this comprehensive assignment solution showcases an adept application of statistics to the domain of insurance claims, covering diverse facets of car usage, driver attributes, and credit scores. The integration of SPSS facilitates the execution of rigorous statistical analysis, leading to valuable insights that can guide decision-making processes for insurance companies.