Problem Description:
This Statistical Analysis assignment presents an in-depth analysis of the impact of the COVID-19 pandemic on the working population in the United States. We explore how organizational actions and the lockdown influenced the attitudes and behaviors of NSU MBA alumni during April-July 2020. Our study reveals that certain management strategies were highly effective in improving employee behavior. Additionally, we assess how different demographic groups responded to the changes in their work environment during the quarantine. The pandemic has introduced elevated stress, anxiety, and burnout among workers as they navigate shifts in their professional and personal lives. Overall, our findings underscore the significant economic, social, and psychological repercussions of the pandemic on the working population.
Solution
Descriptive Data Mining
Data From: CDC, cdc.gov.
The datasets include records on COVID-19 new cases, deaths from COVID-19, and vaccination of the U.S. population over time and across states. The data was obtained from Centers for Disease Control and Prevention (CDC). More data is available at cdc.gov.
Task: Analyze national trends of COVID-19 pandemic
Explore data using descriptive mining techniques.
What technique(s) did you use for what analyses?
Answer:
I Used:
- Correlation analysis in order to analyze the correlations between variables, such as the relationship between new vaccine cases and total vaccine administration.
- Time series analysis to analyze changes in vaccine cases, total vaccine administration, and fully vaccinated people over time.
- Data visualization to visualize the distribution of the data and identify any trends or patterns.
Consider your results:
What trends (patterns) do you observe in COVID-19 pandemic? What possible factors affect pandemic trends?
Answer:
I observed that mortality rates have been inversely correlated to total vaccine doses administered in the population. As to the new covid cases it was inversely correlated too. Up until January 2022 where the vaccine seems less effective in mitigating the spread of the Omicron variant although it is still effective in limiting the covid deaths.
What states were more affected by the pandemic? How can you explain the observed differences among states?
Answer:
The most affected states by the pandemic were California, Texas, Florida, New York. These states are also the most populous states. Therefore it makes sense for them to have more cases. If we correct for the population then the most affected states by the pandemic would be Rhode Island , Alaska, Kentucky, North Dakota.
But in order to really appreciate what states were the most affected by the pandemic, we need to compare the death rates adjusted to the population. And then we find that the states with the highest death rates are Arizona, Oklahoma and Mississippi. These 3 states (especially Oklahoma and Mississippi) are among the 10 less vaccinated states.
Run correlation tests to explore whether there are statistically significant patterns in the data:
Does vaccination assist in the fight against pandemic?
Answer
We find that vaccination is inversely correlated with deaths, and was inversely correlated with new cases before the omicron wave (jan 2022).
What are your overall conclusions from your analyses
Although a combination of population density, demographics, and policy responses likely played a role in the observed differences among states in the impact of the COVID-19 pandemic. Vaccination is still one of the best tools to prevent covid mortality. Although his efficacy in preventing covid spread is open to discussion.
Impact of COVID-19 on Working Population in the U.S.
Data: Employee Survey, NSU.
In April-July 2020, the data on the impact of COVID-19 pandemic on working adults (both quantitative and qualitative) was collected among NSU MBA alumni.
The data set includes perceived attitudes and behaviors of 408 workers and managers during COVID-19 quarantine in Mar-Jun 2020 as well as their demographic characteristics.
Task:Analyze the impact of COVID-19 quarantine on the attitudes and behaviors of employees
Select several variables describing 1) employee attitudes/ behaviors and 2) perceived organizational/supervisory actions that are of interest to you.
Answer
The selected variables regarding:
1) employee attitudes / behaviors are:
- Avoiding Work
- Productivity
- Intent to Quit Organization
- Resistance to Change
2) organizational/supervisory actions are:
- Change Communication Quality
- Organizational Support
- Managerial Support
- Participation in Decision Making
Explore selected variables:
What technique(s) did you use for your analyses?
Answer:
I used correlation analysis and regression analysis in order to find any relation between the perceived organizational/supervisory actions by the employees and their behavioral changes.
Evaluate the impact of the COVID-19 on the attitudes/behavior of employees:
- Do you observe patterns among employee behaviors and perceived organizational/ supervisory actions during quarantine months? You might want to use correlation/ regression analyses to establish the importance of the observed patterns.
Answer :
we run a correlation analysis between our variables and here are the results:
| Managerial Support | Change Communication Quality | Participation in Decision-Making | Organizational Support | |
|---|---|---|---|---|
| Resistance to Change | -0,31449 | -0,35405 | -0,20078 | -0,28288 |
| Productivity | 0,187057 | 0,225672 | 0,108031 | 0,186187 |
| Intent to Quit | -0,29107 | -0,34526 | -0,23562 | -0,37855 |
| AvoidingWork | -0,15232 | -0,07953 | -0,13465 | -0,12736 |
We can observe that Managerial support and change in communication are very efficient to reduce resistance to change. And that change in communication and organizational support are strong deterrent for employees to quit.
In the meanwhile, no strong correlation has been observed regarding Work avoidance and productivity, although changes in communication have helped raise productivity the most and managerial support have helped reduce work avoidance the most.
Are there any differences in attitudes/ behaviors among employees with different demographic characteristics? You might want to use ANOVA techniques to establish the importance of the observed differences.
Answer:
Regarding gender and attitudes, our analysis of variance returned a Prob>F higher than 0.10 for all 4 variables in the employee attitudes / behaviors category. Therefore no specific differences were observed regarding gender.
Regarding Age we have found the following results:
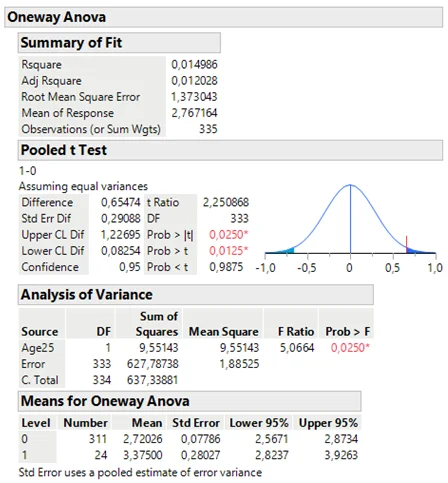
- People less than the age of 25 were more likely to avoid work (P>F=0.02).
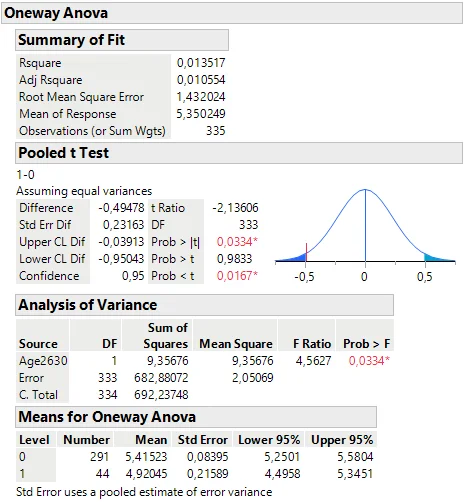
- People in the age bracket [26-30] had lower perceived value of their productivity (P>F = 0.03).
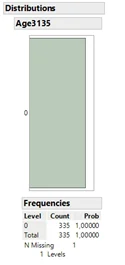
- In our sample no one was in the age bracket [31-35].
- People in the age bracket [36-40] had higher chances to want to quit (P>F = 0.04).
- No particular conclusion could be drawn for the age brackets [46-50], [41-45].
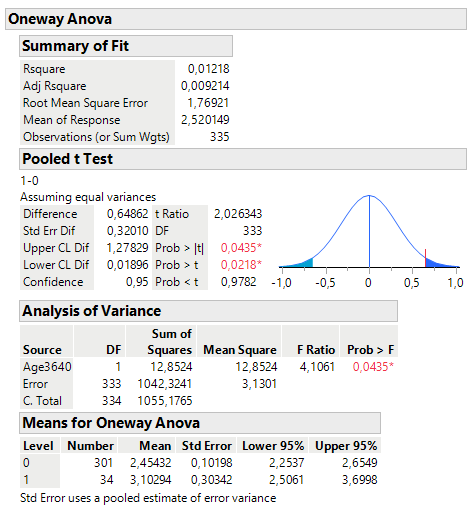
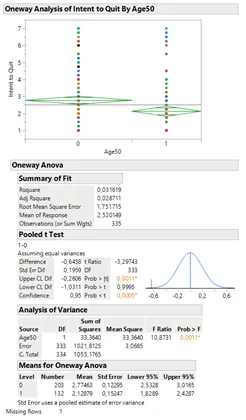
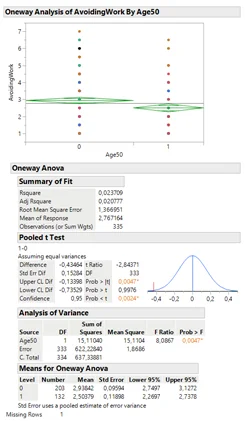
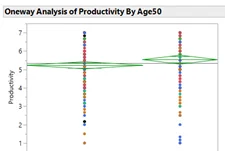
- People over the age of 50 were less likely to quit (P>F = 0.001), less likely to avoid work (P>F = 0.004) and had higher perceived value of their productivity (P>F = 0.05).
Discuss the insights from your analyses, include managerial implications of your results, and report on your findings (5 points). In your report, use visuals and tables strategically, include references (you can use a textbook, software, Internet resource(s), etc.). The report has a particular structure, which you should also follow: Executive Summary, Background, Problem Statement (for example, identifying patterns in the data etc.), Analysis, Conclusions and Recommendations, Bibliography, Appendices.
Management Report for Impact of COVID-19 on working population in the US
Executive Summary
This report study analyzes the effectiveness of some organizational actions and the impact of the lock-down on the working population in the United States. The study evaluates the changes in the behavior of NSU MBA alumni in April-July 2020 in relation to the actions taken by their company/upper management, and examines the psychological impacts of the pandemic on the workforce.
The study finds that some actions taken by the management have been highly effective in improving the quality of work among workers in the US. The study also examines how different demographics react to their work environment during the quarantine. The pandemic has led to increased stress, anxiety, and burnout among workers, as they navigate changes in their work environment and personal lives.
Overall, the study concludes that the pandemic has had significant economic, social, and psychological impacts on the working population, and continued efforts are needed to mitigate these impacts and support workers during and after the pandemic.
Background
The COVID-19 pandemic has brought significant changes to the working population in the United States. The implementation of quarantine measures and social distancing guidelines have resulted in a shift towards remote work and altered working conditions. The impact of these changes on employee attitudes and behaviors, as well as organizational and supervisory actions, is a critical concern for businesses and policymakers. In this context, data was collected from NSU MBA alumni in April-July 2020 to assess the impact of the COVID-19 pandemic on working adults. The dataset includes information on the perceived attitudes and behaviors of 408 workers and managers during the quarantine period in March-June 2020, as well as their demographic characteristics.
Problem
The problem addressed in this report study is whether some organizational actions have been effective at improving employee behaviors among workers in the US during the quarantine period. Furthermore, the study aims to examine the psychological impacts of the pandemic on the workforce, specifically in terms of increased intent to quit, resistance to change, work avoidance and decreased perceived productivity. By addressing these questions, the study can provide insights into the effectiveness of some supervisory actions and the impact of the pandemic on the working population in the US.
Analysis
In our analysis we choose 4 sets of variables for each of the employee behaviors and the company actions.
We will first proceed in a correlation analysis between these variables in order to see what are the most effective and least effective measures that could be taken by a company in order to maximize for a specific employee behavior.
Table 1: Correlation between studied variables
| Managerial Support | Change Communication Quality | Participation in Decision-Making | Organizational Support | |
|---|---|---|---|---|
| Resistance to Change | -0,31449 | -0,35405 | -0,20078 | -0,28288 |
| Productivity | 0,187057 | 0,225672 | 0,108031 | 0,186187 |
| Intent to Quit | -0,29107 | -0,34526 | -0,23562 | -0,37855 |
| AvoidingWork | -0,15232 | -0,07953 | -0,13465 | -0,12736 |
We observe that the Participation in Decision-Making is the least efficient measure with about 0.66 total correlation. In the meanwhile Resistance to change and the intent to quit seems to be the easiest “employee behaviors” we can influence.
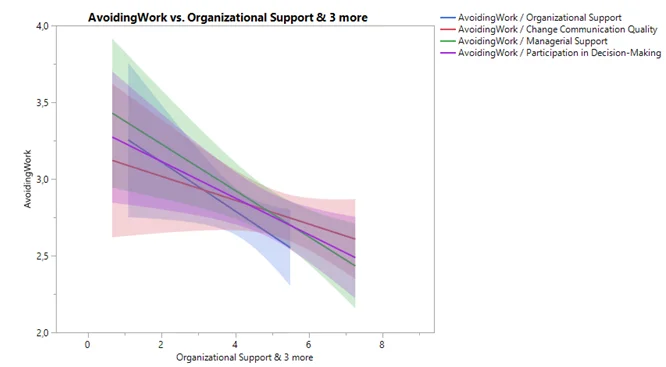
We can observe that Managerial support and change in communication are very efficient to reduce resistance to change. And that change in communication and organizational support are strong deterrent for employees to quit. In the meanwhile, no strong correlation has been observed regarding work avoidance and productivity, although changes in communication have helped raise productivity the most and managerial support have helped reduce work avoidance the most. (figures 1->4)
After that we will confront the employee’s behaviors against their demographic characteristics in order to see how age and sex modify their behaviors. We will proceed with an analysis of variance in order to identify how age and sex influence.
Regarding gender, no particular trend has been found. Regarding age we will proceed with each age bracket and try to find how it varies compared to the rest of the population. This is what we found:
- People less than the age of 25 are more likely to avoid work:
- People in the age bracket [26-30] had lower perceived value of their productivity:
- In our sample no one belonged to the age group [31-35]
- People in the age bracket [36-40] had higher chances to want to quit
- No particular conclusion could be drawn for the age brackets [46-50], [41-45].
- People over the age of 50 were less likely to quit, less likely to avoid work and had higher perceived value of their productivity.
Conclusions and Recommendations
It is apparent from the analysis that some organizational measures are more efficient than others. This analysis should help managers decide what are the most efficient measures to implement in order to target specific problems (ie. High turn-over, low productivity ….)
Appendix
Figure 1: Resistance to change vs organizational and supervisory actions
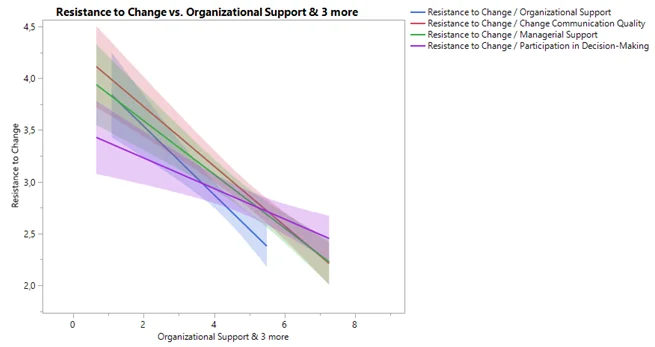
Figure 2: Productivity vs organizational and supervisory actions
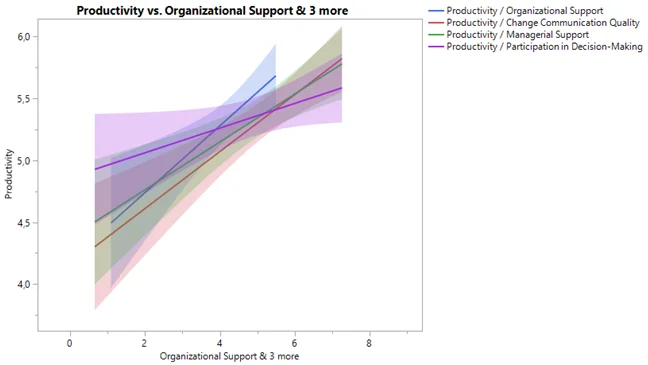
Figure 3: Intent to quit vs organizational and supervisory actions
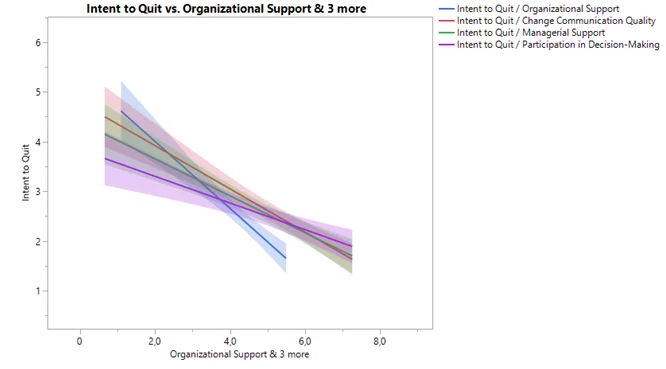
Figure 4: Avoiding work vs organizational and supervisory actions