
Problem Description: First Generation College Students
Question Set 1_A: Research Question: Do more than 25% of all World Campus students identify as first-generation students?
Steps:
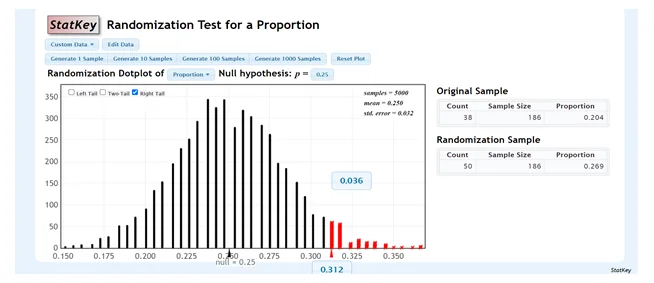
Figure 0.1: Randomization test for a proportion
1. Hypotheses:
- Null Hypothesis: 0.25H0:P≤0.25
- Alternative Hypothesis: 0.25HA:P>0.25
2. Randomization Distribution:
- Use StatKey to construct a randomization distribution with at least 5000 resamples.
3. P-Value Calculation:
- According to StatKey, the p-value is 0.935 in a right-tailed test.
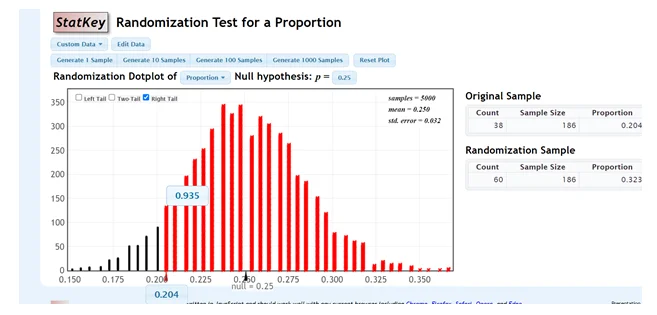
Figure 2: Using StatKey to construct a randomization distribution
4. Decision:
- Since the p-value > significance level, fails to reject the null hypothesis.
5. Conclusion:
- We lack sufficient evidence to support the claim that more than 25% of all World Campus students identify as first-generation students.
Question Set 1_C:
- Compare results from parts 1_A and 1_B.
- Explain why the p-value changed with the increase in sample size.
- The p-value changed due to the larger sample size providing more precise estimates of the population proportion, resulting in a narrower distribution around the hypothesized proportion.
Problem Description: Credit Card Fraud Detection
Question Set 2_A: Research Question: Does the new AI technology detect fraudulent charges more than 97% of the time?
Hypotheses:
- Null Hypothesis: 0.97H0:P≤0.97
- Alternative Hypothesis: 0.97HA:P>0.97
Question Set 2_B: Type I Error:
- Falsely rejects the null hypothesis, indicating the technology detects fraud more than 97% when it does not.
- Consequence: Wasting resources and implementing an ineffective system.
Question Set 2_C: Type II Error:
- Fails to reject the null hypothesis, suggesting the technology does not detect fraud more than 97% when it does.
- Consequence: Missing the chance to enhance fraud detection and exposing customers to fraudulent activity.
Question Set 2_D: Severity Comparison:
- In this scenario, a Type II error is more serious. Failing to invest in the new technology could lead to continued losses from fraudulent charges and potential harm to customers.
Question Set 2_E: Alpha Level Choice:
- Given the consequences, a lower alpha level (e.g., 0.05) is recommended to reduce the likelihood of Type II error.
Reflection:
- Confidence Level:
- High confidence in answers grounded in provided information and hypothesis testing principles.
- Challenges:
- Determining the severity of errors in the specific context was the most challenging aspect.