Problem Statement:
This statistical study involves the integration and analysis of two assessments to examine the relationship between self-identified gender and final exam scores of a student population.
Solution:
Demographic Statistics
The archival database used for this study contained demographic variables describing the sample including identified gender, ethnicity, and year in school. The majority of the sample identified as female (n = 58, 55.24%) or male (n = 37, 35.24%) while a minority identified as transgender (n = 3, 2.86%), and non-binary or non-conforming (n = 4, 3.81%). However, some respondents preferred not to disclose (n = 3, 2.86%). In terms of ethnicity, the majority of the sample identified as white (n = 45, 42.86%), while a minority identified as Black (n = 24, 22.86%), Asian (n = 20, 19.05%), Hispanic (n = 11, 10.48%), and Native (n = 5, 4.76%). Lastly, in terms of years, the majority of the sample identified as Junior year (n = 64, 60.95%), while a minority identified as Sophomore (n = 19, 18.10%), Senior (n = 19, 18.10%), and Freshman (n = 3, 2.86%).
Statistical Measures Used for this Study
This study selected students who identified as female or male to provide group comparisons of their final scores. The hypothesis of this study is ‘students who identify as female will have final scores than students who identify as male’. T-tests were utilized to examine the hypothesis.
Statistical Findings
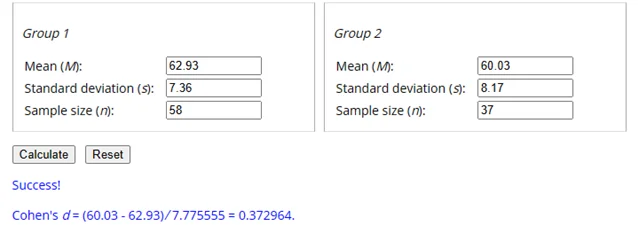
The average final scores of students who identified as female (M = 62.93, SD = 0.97) were higher than those who identified as male (M = 60.03, SD = 1.34). To determine if this difference was significant, an independent sample t-test was performed. The findings of this analysis demonstrated that there was not a significant difference between the self-identified genders (t (93) = 1.80; p = 0.076). Cohen’s d estimated the effect size between female and male student groups as 0.37, indicating that the self-identified genders have a small effect on final scores.
INTERPRETATION OF FINDINGS
This study found that both female and male students achieved the same score on final exams. Hence, it can be inferred that female and male students can perform equally best and have shown the same competency in their final exams.
STATISTICS
Pivot Table
| Row labels | Count of gender identity | Count of gender identity |
| 1 | 58 | 55.24% |
| 2 | 37 | 35.24% |
| 3 | 3 | 2.86% |
| 4 | 4 | 3.81% |
| 5 | 3 | 2.86% |
| Grand Total | 105 | 100.00% |
| Row labels | Count of ethnicity | Count of ethnicity2 |
| 1 | 5 | 4.76% |
| 2 | 20 | 19.05% |
| 3 | 24 | 22.86% |
| 4 | 45 | 42.86% |
| 5 | 11 | 10.48% |
| Grand Total | 105 | 100.00% |
| Row labels | Count of year | Count of year2 |
| 1 | 3 | 2.86% |
| 2 | 19 | 18.10% |
| 3 | 64 | 60.9S% |
| 4 | 19 | 18.10% |
| Grand Total | 105 | 100.00% |
Descriptive Statistics
| Female | Male | ||
| Mean | 62.93 | Mean | 60.03 |
| Standard Error | 0.97 | Standard Error | 1.34 |
| Median | 63 | Median | 61 |
| Mode | 68 | Mode | 60 |
| Standard Deviation | 7.3553 | Standard Deviation | 8.1666 |
| Sample Variance | 54.1004 | Sample Variance | 66.6937 |
| Kurtosis | -0.3222 | Kurtosis | -0.1345 |
| Skewness | -0.3935 | Skewness | -0.2243 |
| Range | 33 | Range | 35 |
| Minimum | 42 | Minimum | 40 |
| Maximum | 75 | Maximum | 75 |
| Sum | 3650 | Sum | 2221 |
| Count | 58 | Count |
37 |
Homogeneity of Variances (Testing for Equality of Variances)
| |
Female | Male |
|---|---|---|
|
Mean 62.93 60.03 |
||
| Variance | 54.10 | 66.69 |
| Observations | 58 | 37 |
| df | 57 | 36 |
| F | 0.8112 | |
| P{F<=f) one-tail | 0.2361 | |
| F Critica lone-tail | 0.6160 | |
Independent Samples T-test
t-Test: Two-Sample Assuming Equal Variances
| |
Female | Male |
|---|---|---|
| Mean | 62.93 | 60.03 |
| Variance | 54.10 | 66.69 |
| Observations | 58 | 37 |
| Pooled Variance | 58.98 | |
| Hypothesized Mean Difference | 0 | |
| df | 93 | |
| t Stat | 1.7973 | |
| P{T<=t) one-tail | 0.0378 | |
| t Critica lone-tail | 1.6614 | |
| P{T<=t) two-tail | 0.0755 | |
| t Critica ltwo-tail | 1.9858 | |
Calculation of Cohen’s d for Effect Size