
Problem Description
In the regression analysis assignment, we explore the intricate world of football statistics through regression analysis. Our goal is to unveil the key factors that influence a football team's win percentage. To do this, we analyze various independent variables to understand their relationships with the dependent variable, 'WinPCT,' which signifies the percentage of games won in a regular season.
Dataset: We collected data on several independent variables, including:
| Variable | Description |
|---|---|
| 'Pass_Completion_Percent' | The quarterback's successful pass percentage. |
| 'Off_Pass_Yards_Per_Att' | Average yards gained per pass attempt. |
| 'Off_Rush_Yards_Per_Carry' | Average yards gained per carry. |
| 'Off_Pass_Touchdown' | The number of touchdowns scored through passing. |
| 'Off_Rush_Touchdowns' | The number of touchdowns scored through rushing. |
| 'Off_Pass_Interceptions' | Unwanted interceptions during passes. |
| 'Off_Rush_Fumbles' | Fumbles during rushing plays. |
| 'Def_Pass_Yards_by_Opponent_Per_Att' | Average yards gained by opposing teams per pass attempt. |
| 'Def_Rush_Yards_by_Opponent_Per_Att' | Average yards gained by opposing teams per carry. |
| 'Def_Touchdowns_By_Opponents' | Touchdowns scored by opposing teams. |
| 'Def_Interceptions' | Interceptions made by the defense. |
| 'Def_QB_Sacks' | Quarterback sacks made by the defense. |
| 'SpecTeams_FG_Total' | Total field goals made by the special teams. |
| 'SpecTeams_FGpct' | Field goal percentage of the special teams. |
| 'SpecTeams_XPpct' | Extra point percentage of the special teams. |
- Table 1: Independent variables
Our aim is to identify which of these variables have the most significant impact on a team's success on the football field.
Model Selection Process: We began our analysis by calculating the correlation between each independent variable and the win percentage. We found that 7 variables showed significant correlation with 'WinPCT.' To understand their combined effect, we performed a multiple linear regression analysis. The results led us to select three significant variables for our final model: 'Off_Pass_Touchdown,' 'Off_Rush_Touchdowns,' and 'Def_Interceptions,' which collectively explained 81% of the variation in 'WinPCT.'
Model Strength Assessment: Our regression model yielded crucial statistics:
- R-Square: The model accounted for 81% of the variability in 'WinPCT,' demonstrating its strength.
- F-Test: The F-value of 39.68, with a p-value of 0.00, indicates that the model as a whole is statistically significant.
- T-Test: Examining each variable's contribution, 'Off_Pass_Touchdown' and 'Off_Rush_Touchdowns' positively influenced 'WinPCT,' while 'Def_Interceptions' had a negative impact.
Interpretations of the Model: The final regression model is as follows: WinPCT = 34.53 + 1.66*(Off_Pass_Touchdown) + 1.49*(Off_Rush_Touchdowns) - 1.19*(Def_Interceptions)
For instance, the coefficient of 'Off_Pass_Touchdown' (1.66) suggests that for each additional passing touchdown, 'WinPCT' is expected to increase by 1.66, holding other variables constant. Based on this model, we can predict a 'WinPCT' of 78.18 for a team with specific stats.
Model Fit and Assumptions: Diagnostic plots indicated that the assumptions of residuals uncorrelated with the model and homoscedasticity were met. The Q-Q plot also suggested normality of residuals. Consequently, we are confident in the validity of our linear regression model.
Appendix:
Model 1 Results: We initially conducted a multiple linear regression analysis with all the independent variables. Here are the results:
| Coefficient | Standard Error | t Stat | P-value |
|---|---|---|---|
| Intercept | 50.84 | 0.68 | 0.51 |
| Pass_Completion_Percent | 0.10 | 0.15 | 0.88 |
| Off_Pass_Yards_Per_Att | -4.66 | -1.00 | 0.33 |
| Off_Pass_Touchdown | 1.81 | 5.04 | 0.00 |
| Off_Pass_Interceptions | -0.74 | -1.27 | 0.22 |
| Off_Rush_Yards_Per_Carry | -0.85 | -0.16 | 0.87 |
| Off_Rush_Touchdowns | 1.51 | 3.05 | 0.01 |
| Off_Rush_Fumbles | 0.29 | 0.39 | 0.70 |
| Def_Pass_Yards_by_Opponent_Per_Att | 5.13 | 1.03 | 0.32 |
| Def_Rush_Yards_by_Opponent_Per_Att | -0.64 | -0.13 | 0.90 |
| Def_Touchdowns_By_Opponents | 0.71 | 1.38 | 0.19 |
| Def_Interceptions | -1.45 | -3.21 | 0.01 |
| Def_QB_Sacks | 0.35 | 1.28 | 0.22 |
| SpecTeams_FG_Total | 0.61 | 1.15 | 0.27 |
| SpecTeams_FGpct | -0.37 | -1.12 | 0.28 |
| SpecTeams_XPpct | -0.21 | -0.50 | 0.62 |
- Table 2: Results of the Multiple Linear Regression with independent variables
Final Model Results: After eliminating non-significant variables, we obtained the following results:
| Coefficient | Standard Error | t Stat | P-value |
|---|---|---|---|
| Intercept | 34.53 | 2.96 | 0.01 |
| Off_Pass_Touchdown | 1.66 | 7.56 | 0.00 |
| Off_Rush_Touchdowns | 1.49 | 5.16 | 0.00 |
| Def_Interceptions | -1.19 | -4.80 | 0.00 |
- Table 3: Results of non-significant variables
Scatterplot Matrix: Figure 1: Scatterplot matrix illustrating the relationships between win percentages and the chosen variables.
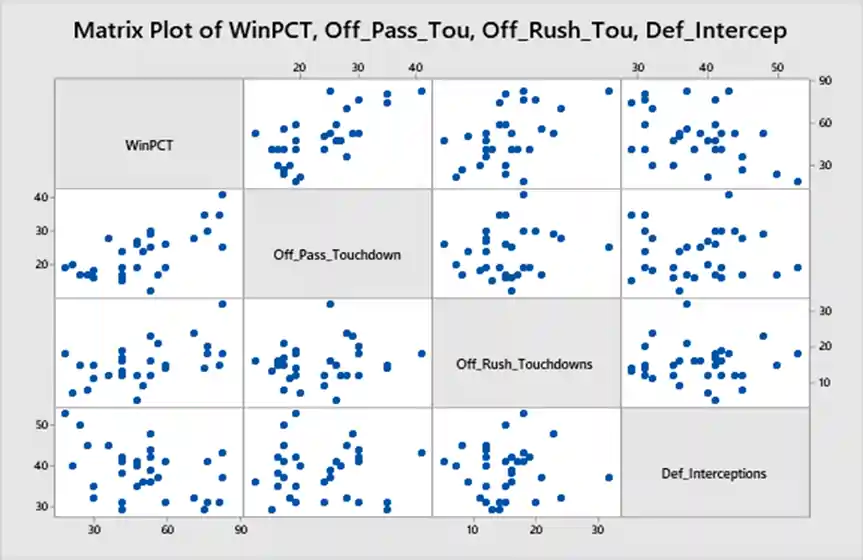
- Fig 1: Scatter plot showing the relationships between win percentages and the chosen variables.
Model Fit Diagnostic Plots: Figure 2: Scatterplot showing the relationship between fitted values and residuals. There is no systematic pattern.
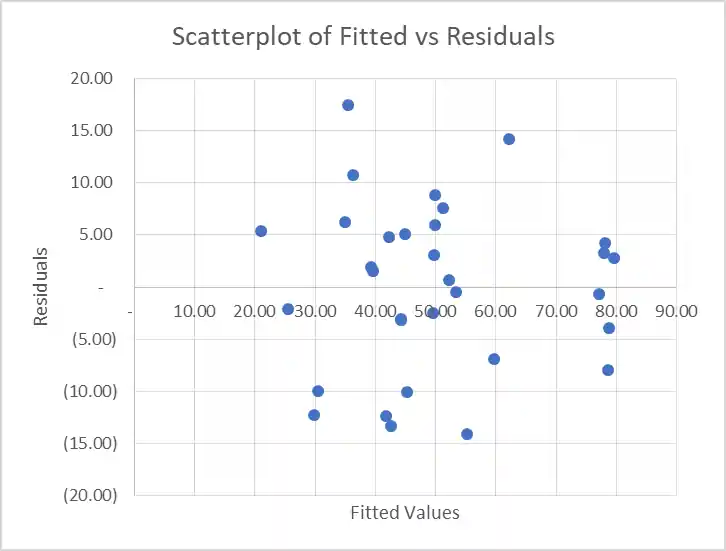
- Fig 2: Scatterplot showing the relationship between fitted values and residuals
Figure 3: Normal Q-Q plot of residuals demonstrating normality.
These diagnostic plots support the validity of our linear regression model and suggest that the key assumptions have been met.
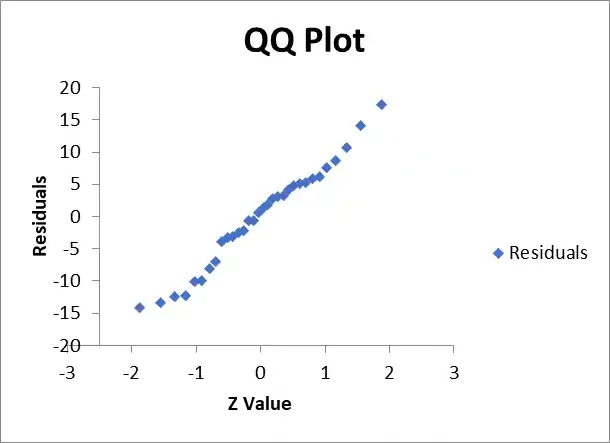
Figure 3: Normal Q-Q plot of residuals