
Problem Description
This assignment delves into fisheries modeling and Statistical Analysis assignment to understand the dynamics of a fishing industry. The primary goal is to evaluate the factors that influence the effort, revenue, cost, and overall profitability in the fisheries sector. We will utilize a dataset and employ statistics to derive meaningful insights.
Question 1: Understanding the Fishing Effort Dynamics
To address this question, we must comprehend the variables at play, with the central one being 'effort' – defined as the number of fishing boats. Between 1995 and 1994, this variable saw an increase. The key equations for this analysis are:
Harvest Function:
- Harvest function = β₀ * effort + β₁ * effort² + ε
- Here, 'effort' represents fishing effort as the number of boats.
Revenue:
- Revenue = α₀ * effort + ε
- Where α₀ is the unit cost of effort.
Cost:
- Cost = pH(E), with 'p' as the constant price of fish.
We use an Excel dataset to visualize the cost, revenue, and harvest function graphs.
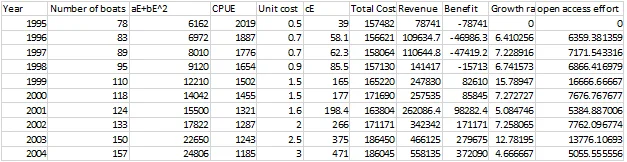
Fig 1: Excel dataset for visualization
We calculate the equilibrium effort using the formula E* = r/2 (1/q - q/kpq²). The biological overfishing problem arises as TSR exceeds TC from 2003 onwards, leading to negative π(t) and minimal opportunities for sustainable fishing in developing countries due to limited resources.
Question 2: Maximizing Economic Net Profit
In question 2, we aim to find the optimal economic net profit, often referred to as the 'breakpoint,' which is the point at which fish farmers achieve maximum profit. This is where the difference between revenue from fish sales and total costs is highest. The analysis revealed negative profit in the fishery sector between 1995 and 1998 due to high unit effort relative to revenue. However, after 1998, net profit becomes positive as efforts improve. The maximum profit, observed in 2001, was $98,282.4, corresponding to an effort level of 124.
Going beyond this point leads to higher costs compared to revenue, while lower effort levels, such as 78, 83, and 89, result in economic losses.
Question 3: Examining the Fishing Dynamics Using an Equation
This question involves an equation for fishing dynamics:
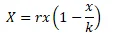
Where:
- r = intrinsic growth rate
- k = carrying capacity
- E = fishing effort
- q = catchability coefficient
Using the provided Excel sheet, we create a graph and a phase plane diagram to visualize the dynamics.
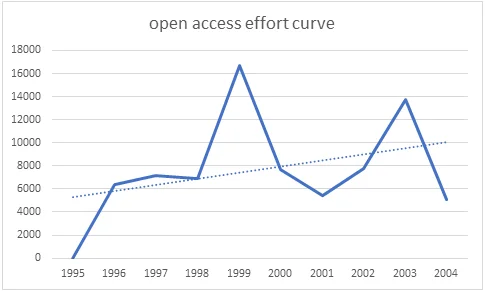
Fig 2: Graph and a phase plane diagram to visualize the dynamics
The open-access curve displays a positive trend but exhibits unpredictability. In 1999, there is a sudden spike in the open-access effort, followed by steady increases. The real part of the eigenvalues being zero indicates a periodic solution with an equilibrium point at the center.