
Problem Description
Analyze the impact of dynamic fuel pricing on diesel prices, focusing on location and days of the week. This study uses a dataset with 35 observations, investigating whether the location of a fuel station and the day of the week affect diesel prices. Factorial ANOVA testing in R is applied to determine the significance of these factors, offering insights into pricing dynamics for fuel industry stakeholders.
Introduction
Gasoline prices are currently changing on a daily basis, a phenomenon known as dynamic fuel pricing. In India, dynamic fuel pricing was introduced in five cities, including Pondicherry and Vishakhapatnam in the south, Udaipur in the west, Jamshedpur in the east, and Chandigarh in the north. After a successful test phase, this pricing policy was adopted nationwide. This project aims to analyze the change in the price of Diesel over a given period of time using data.
Data Description
The dataset for this project contains seven variables: Day, Location, Company, Time, Diesel, ULP91, and ULP98. For this analysis, we focus on three variables: Location and Day (independent variables) and Diesel (the dependent variable). Location and Day are nominal scale independent variables, while Diesel is a continuous dependent variable. The choice of these variables is based on the assumption that location and the day of the week can influence the price of diesel.
Randomly Selected Dataset
The dataset consists of seven treatment combinations with five replications each, resulting in a total of thirty-five observations.
| Day | Location | Diesel |
|---|---|---|
| 7 | 1 | 152.9 |
| 6 | 2 | 151.9 |
| 5 | 3 | 145.9 |
| 4 | 4 | 145.9 |
| 3 | 5 | 157.9 |
| 2 | 6 | 144.9 |
| 1 | 7 | 150.9 |
| 7 | 1 | 144.9 |
| 6 | 2 | 152.9 |
| 5 | 3 | 157.9 |
| 4 | 4 | 152.9 |
| 3 | 5 | 151.9 |
| 2 | 6 | 144.9 |
| 1 | 7 | 145.9 |
| 7 | 1 | 150.9 |
| 6 | 2 | 152.9 |
| 5 | 3 | 144.9 |
| 4 | 4 | 142.9 |
| 3 | 5 | 152.9 |
| 2 | 6 | 145.9 |
| 1 | 7 | 142.9 |
| 7 | 1 | 151.9 |
| 6 | 2 | 142.9 |
| 5 | 3 | 151.9 |
| 4 | 4 | 142.9 |
| 3 | 5 | 157.9 |
| 2 | 6 | 157.9 |
| 1 | 7 | 145.9 |
| 7 | 1 | 157.9 |
| 6 | 2 | 144.9 |
| 5 | 3 | 150.9 |
| 4 | 4 | 150.9 |
| 3 | 5 | 150.9 |
| 2 | 6 | 142.9 |
| 1 | 7 | 151.9 |
Table 1: The Selected Dataset
| Min | 1st Qu. | Median | 3rd Qu. | Max |
|---|---|---|---|---|
| 142.9 | 144.9 | 150.9 | 152.9 | 157.9 |
Table 2: Summary Statistics of the Diesel Data
Exploratory Data Analysis
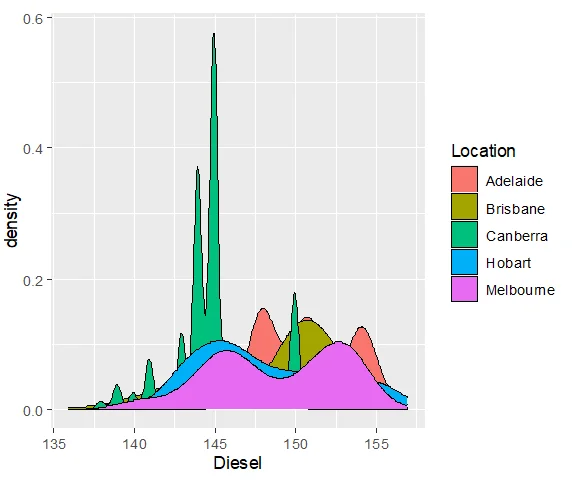
Fig 1: A density plot of Diesel Price by Location
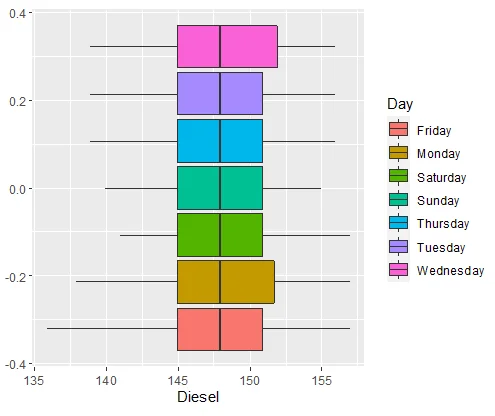 Fig 2: A box plot of diesel price grouped by days
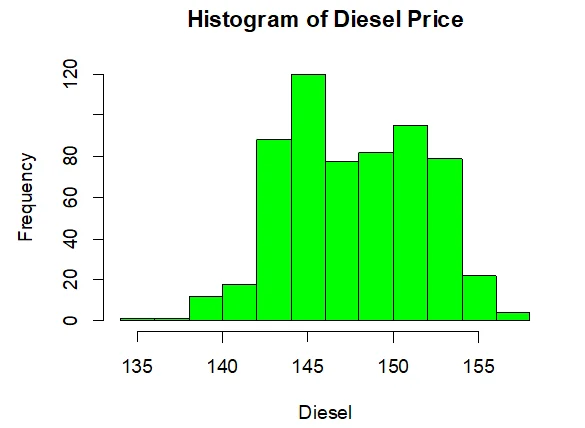
Fig 3: Histogram of Diesel Price
Research Questions
For this project, the following research questions are addressed:
- Is there any effect of the location of a fuel station on the change in the price of diesel?
- Do the days of the week have any relationship with the change in the price of diesel?
Research Hypothesis
Based on the research questions, the following hypotheses are tested:

Research Model
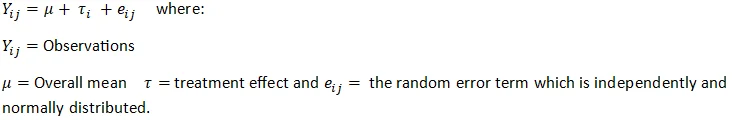
The model for this work is given as:
Factorial ANOVA
The Factorial ANOVA results are presented in the table below:
| Factor | Df | Sum Sq | Mean Sq | F value | Pr(>F) |
|---|---|---|---|---|---|
| Location | 4 | 2315 | 578.7 | 45.434 | <2e-16 *** |
| Day | 6 | 21 | 3.5 | 0.271 | 0.95 |
| Location: Day | 24 | 120 | 5.0 | 0.382 | 0.997 |
| Residuals | 589 | 7502 | 12.7 |
Table 3: ANOVA for the model.
The ANOVA table reveals that location significantly affects the price of diesel (p-value < 0.05). However, the effect of days and the interaction of both days and location on diesel price change are not statistically significant at the 5% level of significance.
LSD Test
The Least Significant Difference (LSD) test results indicate that Melbourne, Brisbane, and Hobart, as locations, have a more significant effect on the change in the price of diesel. Since the interaction effect is not significant, there is no need to perform an LSD test for it.
Summary Statistics:
- Adelaide: Mean Diesel Price = 150.76
- Melbourne: Mean Diesel Price = 148.78
- Brisbane: Mean Diesel Price = 148.56
- Hobart: Mean Diesel Price = 147.95
- Canberra: Mean Diesel Price = 144.70
Groups:
- Adelaide: Group A
- Melbourne: Group B
- Brisbane: Group B
- Hobart: Group B
- Canberra: Group C
This analysis concludes that the location of a fuel station has a significant impact on the change in the price of diesel, while the days of the week do not exhibit a significant relationship with diesel price fluctuations
This project showcases a Factorial Analysis of Variance (ANOVA) for analyzing the change in diesel prices, with a focus on the effect of location and the days of the week. The statistical results suggest that the location of the fuel station is a significant factor influencing diesel price changes, providing valuable insights for stakeholders in the fuel industry.