
Problem Description:
The correlation analysis assignment aims to investigate the relationship and potential causality between two variables through the use of a scatter diagram and correlation coefficient analysis.
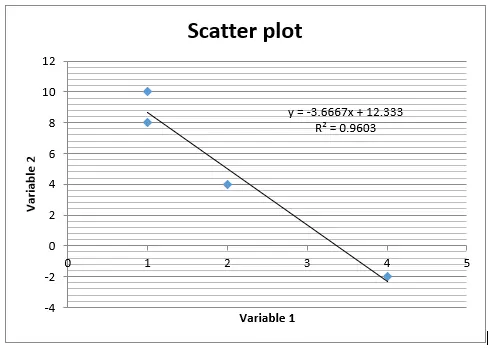
Figure 1: Creating a Scatter Diagram
Description of the General Pattern of Correlation:
The scatter diagram reveals a robust negative linear relationship between Variable 1 and Variable 2. As Variable 1 increases, Variable 2 consistently decreases, forming a tight cluster along a descending straight line.
Correlation Coefficient (r):
The correlation coefficient (r) quantifies this linear relationship, with a calculated value of -0.98. This exceptionally close-to -1 value signifies an extremely strong negative correlation, indicating that as Variable 1 increases, Variable 2 decreases almost perfectly in a linear fashion.
Explaining the Logic:
Correlation, a statistical measure, helps unveil patterns between two variables. In this scenario, Variable 1 and Variable 2 undergo scrutiny. The scatter plot and correlation coefficient reveal the strength and direction of this pattern. With a correlation coefficient of -0.98, the data suggests that changes in Variable 1 are highly predictive of changes in Variable 2. However, correlation alone cannot establish causation.
Possible Directions of Causality:
Determining causality solely from correlation is challenging, but three logically plausible directions are considered:
- Variable 1 causes changes in Variable 2: Implies that alterations in Variable 1 directly influence Variable 2. Improving Variable 1 might lead to a corresponding decrease in Variable 2.
- Variable 2 causes changes in Variable 1: Suggests that changes in Variable 2 drive changes in Variable 1. This direction, while possible, may be less intuitive based on the nature of the variables.
- Third Variable: A third unconsidered variable might be influencing both Variable 1 and Variable 2, creating a false appearance of a direct relationship.
Correlational vs. Cause-and-Effect Studies:
Correlational studies explore relationships without manipulating variables, utilizing correlation coefficients for quantification. However, they do not imply causation. Cause-and-effect studies, often experimental, manipulate variables to demonstrate direct causality. The key distinction lies in the ability to infer causation: correlational studies identify relationships, while cause-and-effect studies seek to prove causality through manipulation and control of variables.