Question 1:
Choose suitable variable/s to run Independent Samples t test. Provide output and a report on your data analysis.
Independent Samples T-test on Fitness Training Time- Problem Description: Investigate if there is a significant difference in mean fitness training time between males and females in a group.
- Hypothesis: H0: μmale=female vs. HA: μmalefemale
- Findings: The p-value is 0.051, indicating a non-significant difference. Do not reject the null hypothesis.
Question 2:
Choose suitable variable/s to run One-Way ANOVA. Provide output and a report on how to write your statistical analysis assignment including findings of Post-hoc analysis if required.
One-Way ANOVA on Depressive Symptoms Score- Problem Description: Explore if there are mean differences in depressive symptoms score across different blood groups.
Hypothesis: at least one population mean is different from another
H0: µ1 (A positive) = μ2 (B positive) = μ3 (AB positive) = μ4 (O positive)
HA: Not all of µ1, μ2, μ3 and μ4 are equal
- Findings: The p-value is 0.000, rejecting the null hypothesis. Post-hoc analysis reveals specific group differences.
Question 3:
Choose suitable variable/s to run Paired Samples t test. Provide output and a report on your data analysis.
Paired Samples t-test on Systolic Blood Pressure- Problem Description: Assess if there is a significant change in systolic blood pressure before and after therapy.
- H0: µ1 (Systolic Blood Pressure Before Therapy) = μ2 (Systolic Blood Pressure After Therapy)
- Findings: Significant difference (p = 0.000) supports the effectiveness of therapy in reducing systolic blood pressure.
HA: µ1 (Systolic Blood Pressure Before Therapy) < μ2 (Systolic Blood Pressure After Therapy)
Question 4:
Choose suitable variable/s to run Pearson’s Chi squared test. Provide output and a report on your data analysis.
Pearson’s Chi-squared test on Therapy and Employment Status- Problem Description: Examine the association between therapy type and employment status.
- H0: There is no association between Therapy and Employment Status
- Findings: Significant association (p = 0.000) between therapy type and employment status.
HA: There exist an association between Therapy and Employment Status
Question 5:
Choose suitable variable/s to run Mann-Whitney u test. Provide output and a report on your data analysis.
Mann-Whitney U test on Self-Rated Health and Gender- Problem Description: Investigate if there are differences in self-rated health between genders.
- H0: The distribution of Self Rated Health is the same across categories of Gender.
- Findings: Significant differences (p = 0.001) in the distribution of self-rated health between genders.
HA: The distribution of Self Rated Health is not the same across categories of Gender.
Question 6:
Choose suitable variable/s to run Wilcoxon Signed Rank test. Provide output and a report on your data analysis.
Wilcoxon Signed Rank test on SPSS Agreement Differences
- Problem Description: Examine if there's a significant median difference in SPSS agreement before and after.
- H0: The median of differences between SPSS Agreement Semester Commencing and SPSS Agreement Semester Ending equals 0.
- Findings: Significant difference (p = 0.000), rejecting the null hypothesis.
HA: The median of differences between SPSS Agreement Semester Commencing and SPSS Agreement Semester Ending is not equal to 0
Question 7:
Choose suitable variable/s to run Pearson’s Correlation analysis. Provide output and a report on your data analysis.
Pearson’s Correlation on Age and Depressive Symptoms Score
- Problem Description: Explore the correlation between age and depressive symptoms score.
- H0: There is no correlation between Age and Depressive Symptoms Score.
- Findings: A weak positive correlation (0.091) is found to be significant (p = 0.032).
HA: There is correlation between Age and Depressive Symptoms Score.
Question 8:
Choose suitable variable/s to run Kruskal-Wallis ANOVA. Provide output and a report on your data analysis.
Kruskal-Wallis ANOVA on Course Weighted Average and Employment Status
- Problem Description: Assess if the distribution of Course Weighted Average differs among employment status categories.
- H0: The distribution of Course Weighted Average is the same across categories of Employment Status.
- Findings: Significant difference (p = 0.044) in the distribution across employment statuses.
HA: The distribution of Course Weighted Average is not the same across categories of Employment Status.
Question 9:
Choose suitable variable/s to run Spearman’s Rho analysis. Provide output and a report on your data analysis.
Spearman’s Rho on Fitness Training Time and Email Time
- Problem Description: Examine if there's a correlation between fitness training time and email time.
- H0: There is no correlation between Fitness training time and Email time.
- Findings: No significant correlation (p = 0.087) is observed.
HA: There is correlation between Fitness training time and Email time.
Question 10:
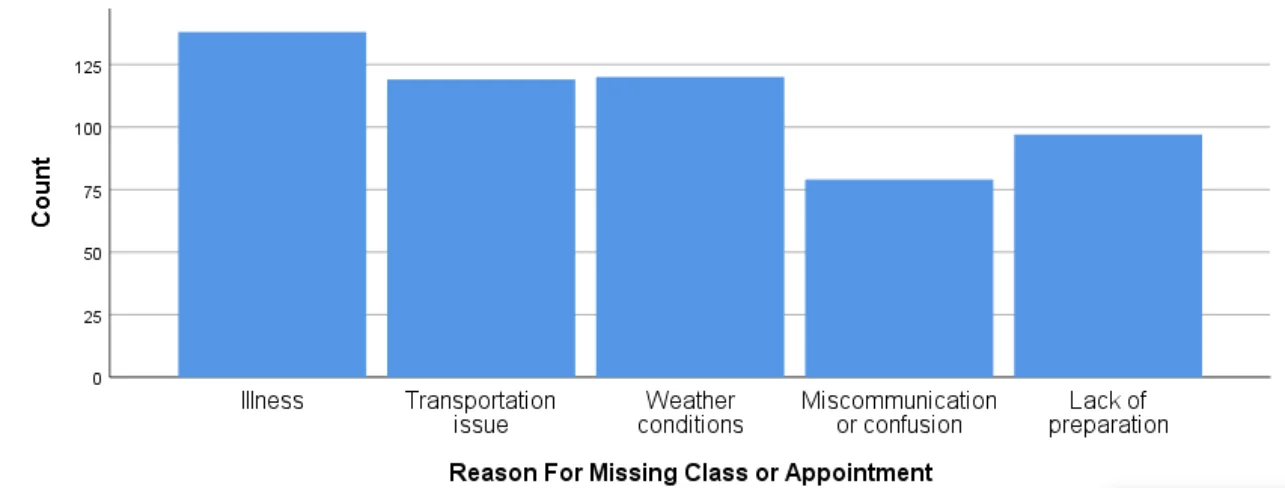
All participants were asked to provide a reason for missing their most recent class/appointment. Five most common reasons are coded as A, B, C, D & E (Variable: ReasonForMissingClass/Appointment).
Reason for Missing Class/Appointment - Bar Graph
- Problem Description: Explore the reasons (codes A, B, C, D, E) participants provided for missing their most recent class/appointment.
- Graph: Bar graph depicting the frequency of each reason code with appropriate labels.