
Problem Description
This assignment delves into three Statistical Analysis assignment. Firstly, it explores the strong positive correlation between 10th-grade and 12th-grade science achievement, utilizing a regression model. Secondly, it tests for a significant difference in final exam scores between in-person and Zoom class attendees. Finally, it investigates the influence of geographic location on 12th-grade math achievement using ANOVA. The results provide valuable insights into educational and geographical impacts on academic performance.
Problem 1:
Analysis of 10th and 12th Grade Science Achievement
In this problem, we conducted an analysis to determine the relationship between 10th-grade science achievement and 12th-grade science achievement. Here are the key findings:
Model Summary
| Model | R | R Square | Adjusted R Square | Std. Error of the Estimate |
|---|---|---|---|---|
| 1 | .786a | .618 | .617 | 5.30447 |
Table 1: Predictors: (Constant), Tenth Grade Science Achievement
Coefficientsa
| Model | Unstandardized Coefficients | Standardized Coefficients | t | Sig. | ||
|---|---|---|---|---|---|---|
| B | Std. Error | Beta | ||||
| 1 | (Constant) | 14.577 | 1.658 | 8.789 | .000 | |
| Tenth Grade Science Achievement | .739 | .029 | .786 | 25.233 | .000 | |
Table 2: Dependent Variable: Twelfth Grade Science Achievement
- Correlation: The correlation between the two variables is 0.786, indicating a strong positive correlation. This means that higher 10th-grade science achievement is associated with higher 12th-grade science achievement.
- Regression Equation: achsci12 = 14.577 + 0.739 * achsci10
- Coefficient of Determination: The coefficient of determination (R Square) is 0.618, indicating that 61.8% of the variability in the dependent variable (12th-grade science achievement) is explained by the model.
- Coefficient of Non-Determination: The coefficient of non-determination is 0.382, suggesting that 38.2% of the variation in the dependent variable is not explained by the model.
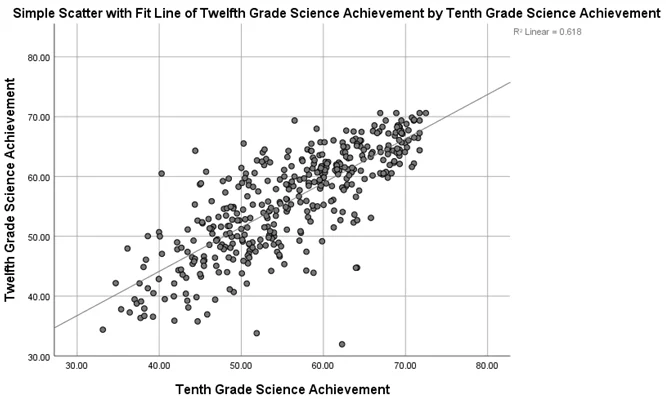
Fig 1: Scatterplot with fit line of 12th grade science achievement
Problem 2:
Comparison of Exam Scores for Zoom and In-Person Classes
This problem involves testing whether there is a significant difference in average scores on a final exam between students who attended classes on Zoom and students who attended classes in person.
Hypotheses:
- Null Hypothesis (H0): The average scores on the final exam are the same for both Zoom and in-person classes.
- Alternative Hypothesis (Ha): The average scores on the final exam differ between Zoom and in-person classes.
Paired Samples Test:
The t-test value is -2.689, and the correlation between Zoom and in-person class scores is 0.359.
| Paired Samples Test | |||||||||
|---|---|---|---|---|---|---|---|---|---|
| Paired Differences | t | df | Sig. (2-tailed) | ||||||
| Mean | Std. Deviation | Std. Error Mean | 95% Confidence Interval of the Difference | ||||||
| Lower | Upper | ||||||||
| Pair 1 | Attending in Zoom - Attending in Person | -4.20000 | 4.93964 | 1.56205 | -7.73360 | -.66640 | -2.689 | 9 | .025 |
| Paired Samples Correlations | ||||
|---|---|---|---|---|
| N | Correlation | Sig. | ||
| Pair 1 | Attending in Zoom & Attending in Person | 10 | .359 | .308 |
Paired Samples Test Tables
Result:
The t-test for correlated samples revealed that attending in person produced significantly different average scores in the final exam (M=84.00) compared to students attending on Zoom (M=79.80). The t-statistic is -2.689, and the p-value is less than 0.05, indicating a significant difference.
Problem 3:
Impact of Geographic Location on 12th Grade Math Achievement
In this problem, we examined the impact of geographic location on 12th-grade math achievement. Here are the key findings:
Descriptive Statistics: The mean, standard deviation, and other statistics for 12th-grade math achievement are provided for different geographic regions.
Descriptives
Twelfth Grade Math Achievement
| N | Mean | Std. Deviation | Std. Error | 95% Confidence Interval for Mean | Minimum | Maximum | ||
|---|---|---|---|---|---|---|---|---|
| Lower Bound | Upper Bound | |||||||
| Northeast | 80 | 58.9418 | 7.48700 | .83707 | 57.2756 | 60.6079 | 34.36 | 70.42 |
| North Central | 100 | 55.6329 | 8.12019 | .81202 | 54.0217 | 57.2441 | 34.88 | 70.18 |
| South | 144 | 56.2279 | 8.07886 | .67324 | 54.8971 | 57.5587 | 35.48 | 70.69 |
| West | 75 | 58.1313 | 7.99595 | .92329 | 56.2916 | 59.9710 | 36.57 | 71.05 |
| Total | 399 | 56.9807 | 8.03430 | .40222 | 56.1900 | 57.7714 | 34.36 | 71.05 |
Table 4: Descriptive statistics- Results of SPSS
Test of Homogeneity of Variances: The test indicates that there is homogeneity of variance among the groups.
Test of Homogeneity of Variances
| Levene Statistic | df1 | df2 | Sig. | ||
|---|---|---|---|---|---|
| Twelfth Grade Math Achievement | Based on Mean | .707 | 3 | 395 | .548 |
| Based on Median | .636 | 3 | 395 | .592 | |
| Based on Median and with adjusted df | .636 | 3 | 394.094 | .592 | |
| Based on trimmed mean | .752 | 3 | 395 | .522 | |
Table 5: Test of Homogeneity of Variances
ANOVA: An analysis of variance (ANOVA) was performed, showing that there is a significant impact of geographic location on 12th-grade math achievement.
ANOVA
Twelfth Grade Math Achievement
| Mean Square | F | Sig. |
|---|---|---|
| 223.404 | 3.527 | .015 |
| 63.344 |
Table 6: ANOVA Results
Conclusion: Students from different geographic regions have varying levels of math achievement, with the Northeast region having the highest mean score and the North Central region having the lowest. The one-way ANOVA test confirms that these differences are statistically significant.