
Problem Description
The dataset under consideration contains information on respondents' marital status, age, and socioeconomic index. Socioeconomic index is a continuous variable that reflects differences in occupation prestige based on educational requirements and earnings, with scores ranging from 7 to 81. Age, on the other hand, is a continuous variable measured in years. Marital status is a categorical variable with five levels: married, widowed, divorced, separated, and never married.
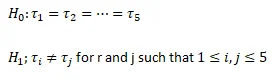
The null and alternative hypotheses for this test are as follows:
- Null Hypothesis (H0): There are no significant differences in the means of socioeconomic index and age across the various marital status categories.
- Alternative Hypothesis (H1): There are significant differences in the means of socioeconomic index and age across the various marital status categories.
Solution
A MANOVA test was conducted to examine the association between marital status, age and socioeconomic index. The null and alternative hypotheses for this test is stated as:
Where
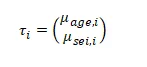
The dependent variables are socioeconomic index and age. The socioeconomic index is a continuous variables which summarizes differences in occupation prestige based on the required education and earnings. The score ranges between 7 and 81. Age on the other hand is a continuous variable measured in number of years. The independent variable is marital status. Marital status is a categorical variable with 5 levels. The level of measurement are married, widowed, divorced, separated and never married.
The descriptive statistics showed that 42.06% of respondents are married, 8.73% are widowed, 20.75% are divorced, 3.51% are separated and 24.94% are never married. Socioeconomic index was the highest for the married group (M=52.01, SD=23.36) followed by the divorced (M=42.83, SD=22.54) followed by never married (M=41.13, SD=20.07). Respondents who are separated have the lowest socioeconomic index (M=34.63, SD=21.28) and widowed respondents have slightly higher socioeconomic index (M=36.9, SD=18.67). Widowed respondents have the highest average age (M=68.05, SD=12.23) followed by divorced respondents (M=55.11, SD=13.36) then by Separated respondents (M=51.19, SD=18.65). never married respondents have the lowest average age (M=36.92, SD=14.19).
The result of the Box M test of equality of covariance matrix rejected the null hypothesis that data from all groups have equal variance-covariance matrix (Box M=30.201, F(12,123405.5)=2.49, p=0.003). This means that the assumption of equality of variance-covariance matrix is violated. Similarly, the Levene tests of equality of error variance for each individual dependent variable revealed that for socioeconomic index, we reject the null hypothesis of equality of error variance (F (4,877) = 6.38, p<.001). Likewise, the null hypothesis of equality of error variance was rejected for age (F (4,877) = 3.73, p=.005). The result connotes that the assumption of equality of error variance is violated for the two groups.
The multivariate test showed that all the statistics are significant. Specifically the Wilk’s Lambda showed that there is significant multivariate effect for age and socioeconomic index in relation to marital status (Wilks Λ=0.679,F(8,1752)=46.79,p<.001). The multivariate R2 is given as 1-wilks Λ=0.321 which means that 32.1% of variation in age and socioeconomic index is explained by marital status.
A separate univariate ANOVA was conducted for each of the dependent variables and the result showed that a significant difference in average socioeconomic index is found across marital status groups (F(4,877)=15.877, p<.001). Similarly, a significant difference in average age is found across marital status groups (F (4,877)=81.27, p<.001).
Since a significant univariate ANOVA was found, a post-hoc test was used to determine which group pairs are significantly different or not. The result showed that Married respondents have significantly different socioeconomic index than widowed (p<.001), divorced (p<.001), separated (p<.001) and never married respondents (p<.001). There is no other pairs that have significantly different socioeconomic index. For age of respondents, married respondents have significantly different average age than widowed (p<.001), divorced (p=.002) and never married respondents (p<.001). In addition, widowed respondents have significant different average age from divorced respondents (p<.001), separated respondents (p<.001) and never married respondents (p<.001). Divorced has significant different average age from never married respondents (p<.001).
In line with the research question, the result showed that there is significant influence of marital status on an increase in an individual’s socioeconomic index. Moreover, being married increase the chance of having higher socio-economic index. The implication of the result for social change is that all measures to improve socioeconomic index should consider marital status such that the disadvantage group are given more priority in the program.