
Problem Description:
The ESG financial performance analysis assignment explores the intricate relationship between Environmental, Social, and Governance (ESG) scores and financial performance across companies. The core question revolves around whether there exists a trade-off between ESG commitments and financial success, or if they coalesce into genuine long-term value creation.
Analysis Overview:
Step 1: ESG Trend Analysis
In this initial phase, we aim to discern the trajectory of average ESG scores over the past two decades. The process involves consolidating multiple ESG score columns for each company, calculating the average ESG score per company for each year, and subsequently deriving the overall average ESG score for all companies annually. The resulting plot indicates a general upward trend in ESG ratings, signifying an overall improvement in ESG performance across industries. It's essential to acknowledge that the dataset extends up to 2021, leaving room for potential variations in more recent trends.
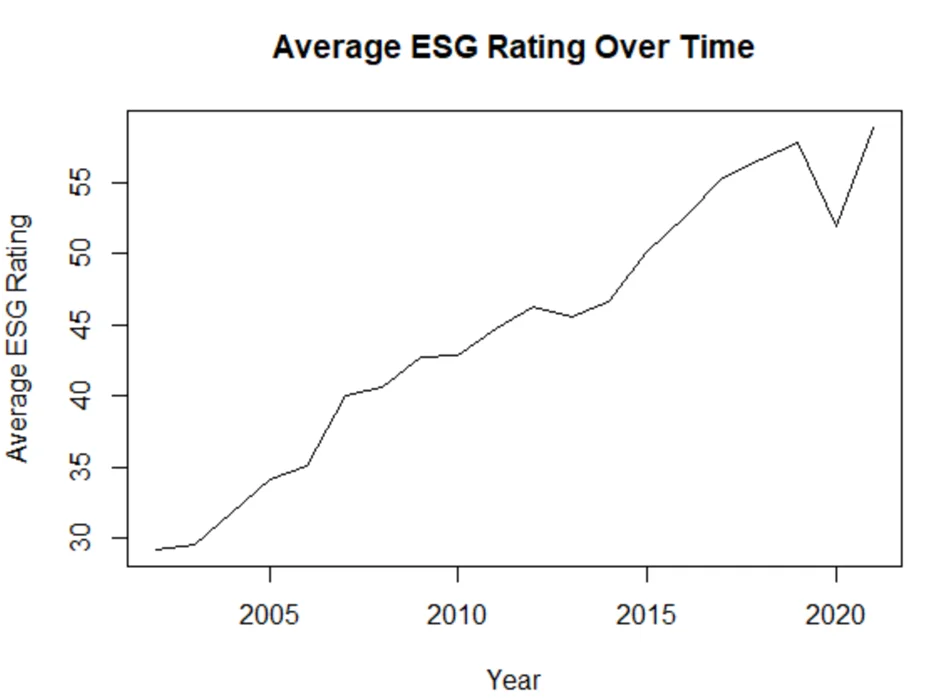
Table 1: The average ESG rating over the two decades
Step 2: Portfolio Sorting for Financial Measures
Moving to the crux of the analysis, we delve into portfolio sorting based on ESG scores concerning financial performance metrics—Return on Equity (ROE), Return on Invested Capital (ROIC), and Revenue (Re). The steps include:
- Extracting relevant columns from the financial datasets (ROE, ROIC, Re) spanning 2003-2021.
- Calculating ESG scores for the previous year using the ESG_Combined_Score dataset.
- Extracting pertinent columns from the ESG_Combined_Score dataset covering 2002-2020.
- Merging ESG scores with financial performance data based on company and year.
- Sorting ROE, ROIC, and Re for each year based on the preceding year's ESG scores.
- Creating four portfolios for each financial metric, distributing stocks based on ESG score rankings.
- Calculating average ROE, ROIC, and Re for each portfolio, handling missing values.
- Repeating steps 5-7 from 2003-2021.
- Computing mean and volatility for each portfolio.
- Establishing three long-short portfolios for each financial metric—going long on the highest ESG portfolio and shorting the lowest ESG portfolio.
- Calculating mean and volatility for each long-short portfolio.
- Conducting a hypothesis test, scrutinizing whether the mean of each long-short portfolio is zero, leveraging the provided t-statistic.
By meticulously following these steps, the analysis aims to uncover nuanced insights into the intricate interplay between ESG practices and financial outcomes for companies over the past two decades.