
Problem Description:
In this Statistical Analysis assignment, we explore the factors influencing the demand for contraception across different countries. The assignment is divided into several questions, each focusing on various aspects of the topic. We analyze panel data using Stata to investigate the impact of cultural, economic, technological, and political factors on contraception use.
Solution
Question a
- Cultural and Religious Beliefs: Attitudes towards contraception can be influenced by cultural and religious beliefs that discourage or forbid its use. For example, in some countries, traditional beliefs and values may promote large families, and the use of contraception may be stigmatized or considered immoral.
- Education and Awareness: Education and awareness campaigns can play a significant role in increasing the use of contraception. For example, women with higher levels of education are more likely to use contraception than those with lower levels of education. Similarly, access to information about contraception and reproductive health can increase demand and uptake.
- Healthcare System: The availability and quality of healthcare services can also impact the use of contraception. Access to affordable and high-quality contraceptive services can make a significant difference in the uptake and continued use of contraception. Conversely, limited access to healthcare services can act as a barrier to contraception uptake.
Question b
- World Economic Trends: The demand for contraception may be impacted by global economic trends. For instance, financial restrictions during economic downturns may result in decreased demand for contraception, but better availability and affordability during economic expansion may result in increased demand.
- Technological Developments: The demand for and adoption of contraception may be impacted by technological developments. Demand for contraception may rise when new, more potent methods become available, but adoption of new technologies may be hindered by restricted access to new technologies.
- Political Environment: The demand for contraception can also be impacted by the political environment of a nation. For instance, policies that encourage access to contraception and reproductive rights might boost demand, whereas laws that restrict access to contraception can discourage use. Political unrest can also affect the accessibility and distribution of contraceptives.
Question c
* Panel Data Models in Stata
clear all
set more off
import excel "C:\Users\user\Desktop\UNData.xlsx", sheet("Sheet1") firstrow
global Country Country
global Year Year
Describe CPR UNFPA Country Year
| storage | display | value | ||||
|---|---|---|---|---|---|---|
| variable | name | type | format | label | variable | label |
| CPR | double | %10.0g | CPR | |||
| UNFPA | byte | %10.0g | UNFPA | |||
| Country | byte | %10.0g | Country | |||
| Year | int | %10.0g | Year | |||
Summarize CPR UNFPA Country Year
| Variable | Obs | Mean | Std. Dev. | Min | Max |
|---|---|---|---|---|---|
| CPR | 690 | .7013043 | .8815549 | -2.4 | 7.7 |
| UNFPA | 690 | .0797101 | .2710404 | 0 | 1 |
| Country | 690 | 35 | 19.93094 | 1 | 69 |
| Year | 690 | 2008.5 | 2.874365 | 2004 | 2013 |
* Set data as panel data
sort $Country $Year
xtset $Country $Year
panel variable: Country (strongly balanced)
time variable: Year, 2004 to 2013
delta: 1 unit
xtdescribe
Country: 1, 2, ..., 69 n = 69
Year: 2004, 2005, ..., 2013 T = 10
Delta(Year) = 1 unit
Span(Year) = 10 periods
(Country*Year uniquely identifies each observation)
| Distribution | of | T_i: | min | 5% | 25% | 50% | 75% | 95% | max |
|---|---|---|---|---|---|---|---|---|---|
| 10 | 10 | 10 | 10 | 10 | 10 | 10 |
| Freq. Percent | Cum. | Pattern |
|---|---|---|
| 69 100.00 | 100.00 | 1111111111 |
| 69 100.00 | XXXXXXXXXX |
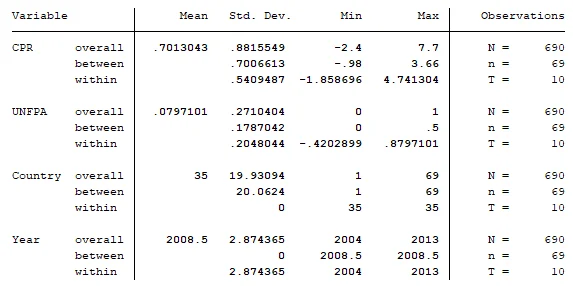
xtsum CPR UNFPA Country Year
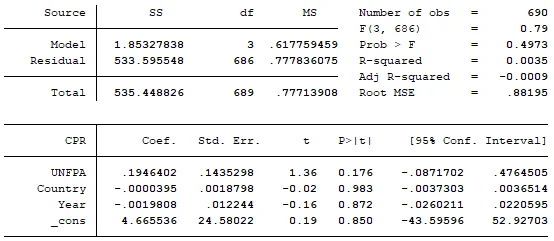
*Pooled OLS estimator
reg CPR UNFPA Country Year
*Fixed effects or within estimator
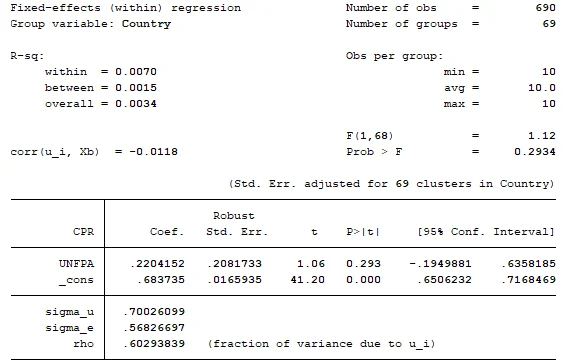
xtreg CPR UNFPA, fe vce(cluster Country)
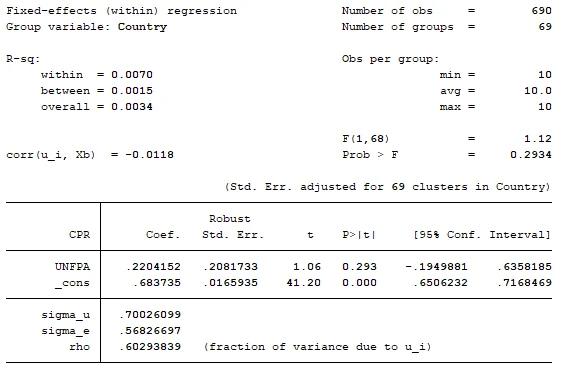
At 0.05 significance level, the coefficient of UNFPA has a p-value (0.293) greater than the critical p-value (0.05) therefore it is not significant.
Question d
* Fixed effects without clustered standard error
xtreg CPR UNFPA, fe
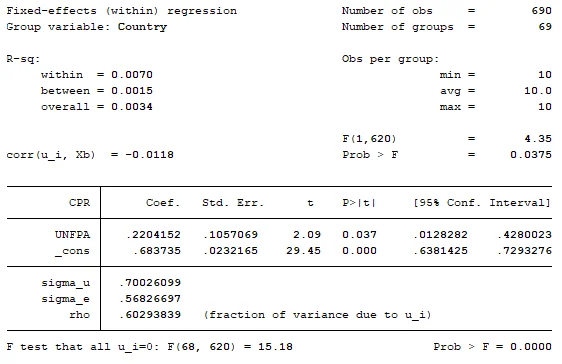
At 0.05 significance level, the coefficient of UNFPA has a p-value (0.037) less than the critical p-value (0.05) therefore it is significant.
Question e
*Adding Years as dummy variables
xtreg CPR UNFPA i.Year, fe vce(cluster Country)
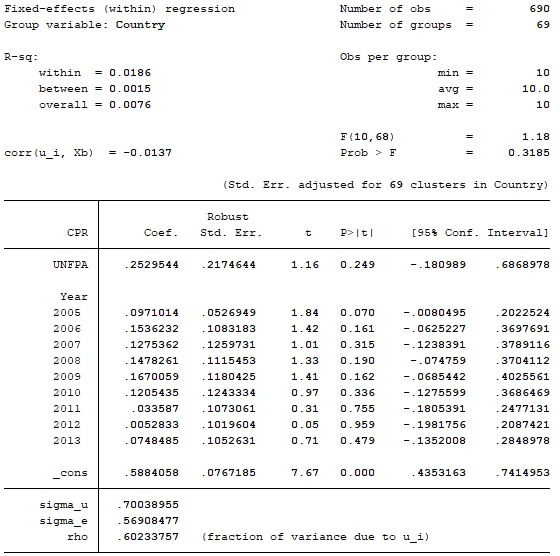
The year 2004 has been dropped by STATA to avoid perfect multicollinearity. There has been a greater increase in the level of coefficient of interest and the p-value.
Question f
*Test that all the year dummies are equal to zero
testparm i.Year
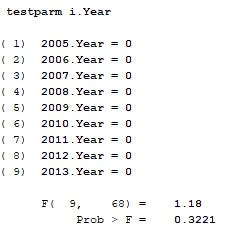
The p-value of this F-test more than 0.05. We fail to reject the null hypothesis.
Question g
* Fixed effects or within estimator for total demand
xtreg CPR UNFPA, fe vce(cluster Country)
*Adding Years as dummy variables for total demand
xtreg CPR UNFPA i.Year, fe vce(cluster Country)
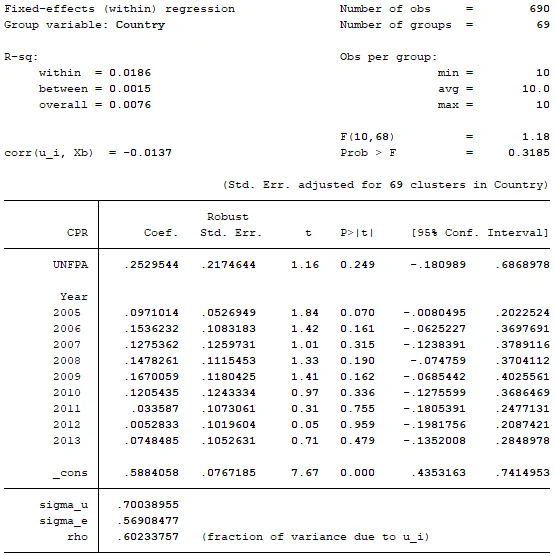
The answers for this question are close to the ones provided on table 2 above.
Question h
The problem of correlated errors or the clustering of observations within groups in panel data analysis, where observations within a group may be more similar to one another than observations across groups, is addressed with clustered standard errors. The drawback of utilizing just heteroskedasticity-robust standard errors in fixed effects models is that they do not take into consideration the correlation between data within groups. This may result in understated standard errors, too-low p-values, and erroneous statistical significance determinations. The correlation among the data within the same group is taken into consideration when clustering the standard errors at the group level, producing more accurate standard errors and trustworthy inference.
Question i
The data need not be iid (independent and identically distributed) along either dimension, entity, or time according to panel data modeling principles. In actuality, the possible correlation and heterogeneity in the data along both dimensions are explicitly considered by panel data models.
Panel data models' core premise is that the individual entities—such as nations or people—have fixed effects or time-invariant traits that are not readily visible but may have an impact on the outcome variable. In panel data models, the time dimension is especially crucial since it enables the examination of changes in the outcome variable across time while accounting for the fixed effects of specific entities.
As a result, the panel data modeling assumptions rely on the assumptions of stationarity (fixed effects) along the entity dimension and on temporal dependency along the time dimension rather than requiring the data to be iid.