
Problem Description:
In the data analysis assignment, we explore the prediction of default in a customer's credit card debt based on their balance using a probit model. We are provided with data in "Default.xlsx," which includes information on 10,000 observations with four variables: default (indicating whether the customer defaulted on their debt), student (indicating whether the customer is a student), balance (the average balance remaining after monthly payments), and income (customer's income).
Question 1: Default Prediction
We estimate the probit model:
Pr(Default=1∣balance)=ϕ(β0+β1∗balance)
Given equation: Pr(Default=1∣balance)=ϕ(5.352−2.711∗balance)
The estimate for β1 is -2.711.
Question 2: Scatter Plot of Predicted Probabilities
We visualize the relationship between predicted probabilities and balance with a scatter plot, placing balance on the horizontal axis.
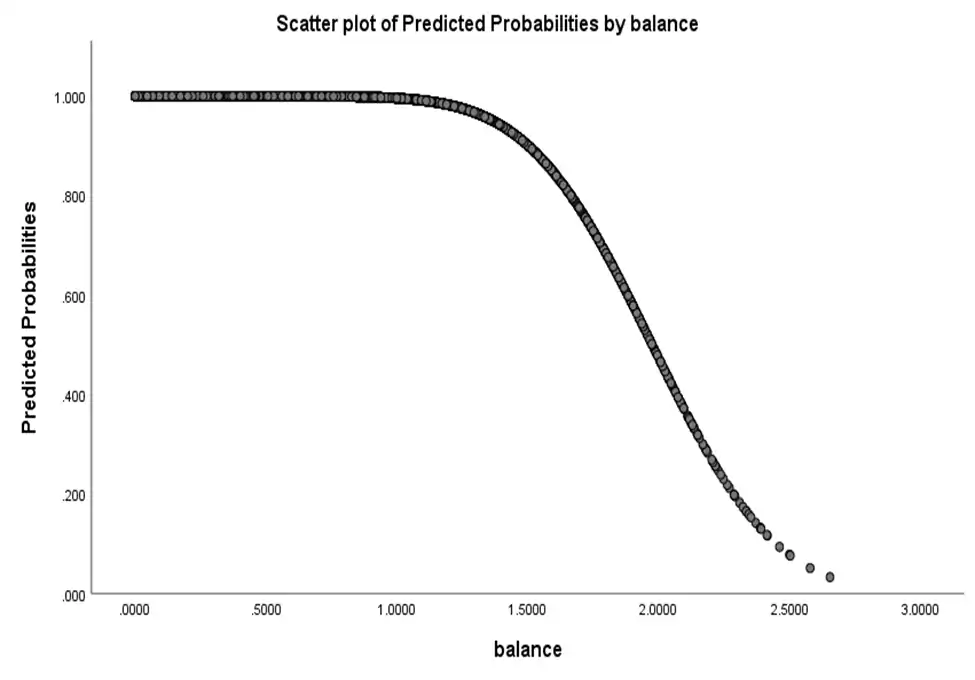
- Fig 1: Scatter plot of predicted probabilities by balance
Question 3: GDP Growth Analysis
For this part of the assignment, we use data from "gdpgr_korea.xlsx," providing quarterly GDP growth data for Korea, where "GDPGR" is the annualized growth rate of real GDP (%).
Question 3: Time Series Plot of GDP Growth
We create a time series plot of GDPGR to explore trends and fluctuations in Korea's GDP growth.
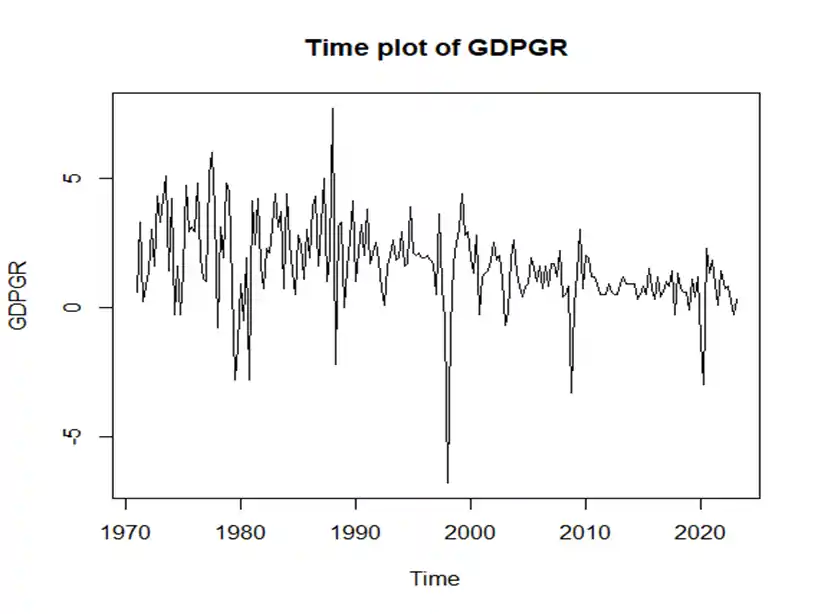
- Fig 2: Time Plot of GDPGR
Question 4: Autocorrelation Analysis
We calculate the first autocorrelation of GDPGR to understand the dependence between GDP growth rates in consecutive quarters (result: 0.2808).
Question 5: GDP Growth Prediction
Using an AR(2) model for GDPGR, we predict GDP growth in the second quarter of 2023, providing point forecasts and confidence intervals:
- Point Forecast for 2023 Q2: 1.012657
- 80% Confidence Interval: [-1.030577, 3.05589]
- 95% Confidence Interval: [-2.112199, 4.137512]
The estimated GDP growth for Q2 2023 is 1.01.