
Problem Description:
This assignment on Biostatistics focuses on the data analysis of a study concerning the spread and infection of COVID-19 among students at the University of Sydney. The dataset includes various variables related to demographics, health, and COVID-19 experiences. The goal is to apply statistical methods to gain insights into the data, identify patterns, and draw meaningful conclusions.
Question 1:
- Population of interest includes a group of aspects not limited to human subjects that have something in common (Bloomfield& Fisher,2019). This study focuses on COVID-19 spread and infection among students within the University of Sydney, thus, students of the University of Sydney are the population of interest for this study.
- Non-sampling errors are various sources of errors that are not related to sampling and are usually present in all types of surveys. Thus, there is a possibility of non-sampling error in this data. In this data set, non-sampling error in this data set can occur from missing data or respondent error where respondents could possibly provide incorrect answers or tend to exaggerate or underplay events (Chen &Haziza, 2019).
- In for this population of interest, non-sampling error can be minimized by increasing the sample size and randomizing selection to eliminate biases that may exist within the selected sample.
Solutions:
Population of Interest and Non-Sampling Errors
Population of Interest:
- The population of interest for this study comprises students at the University of Sydney, emphasizing their experiences with COVID-19.
Non-Sampling Errors:
- Non-sampling errors, such as missing data and respondent errors, can influence the dataset. To minimize these errors, increasing the sample size and randomizing selection are suggested strategies.
Question 2: Data Cleaning and Variable Analysis
• Age:
- Omitted 12 missing and implausible age values, resulting in 94 valid observations.
Livewith:
- Removed 5 missing and implausible livewith values, leaving 91 valid observations.
Willing:
- Deleted 1 missing value in the "Willing" variable, resulting in 91 valid observations.
Question 3: Statistical Confidence Score Analysis
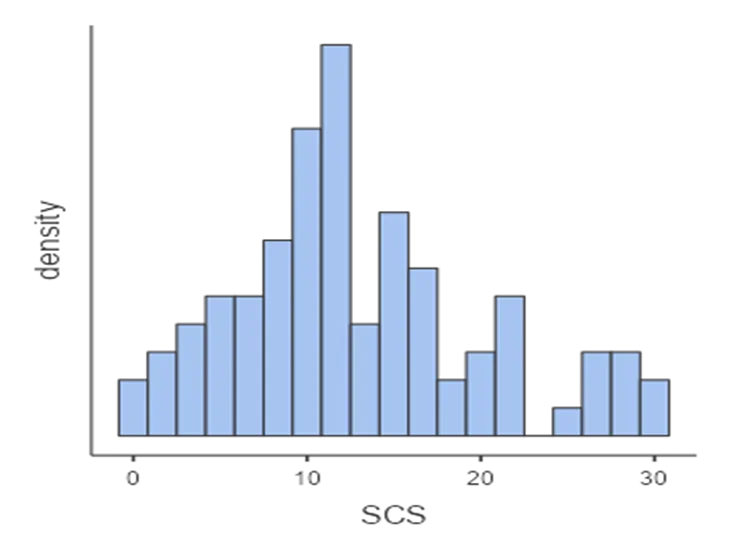
Figure 1: Histogram showing statistical confidence score for the participants
Histogram:
- Presents a histogram showing the statistical confidence scores of participants.
- Noteworthy points include an unimodal, normally distributed shape with a mean value of 13.0 (SD 7.23).
Question 4: Two-Way Contingency Table Analysis
Table 1:
| Meets recommended vegetable intake | Does not meet vegetable intake | Total | |
| Male (2) | 0 | 25 | 25 |
| Female (1) | 1 | 64 | 65 |
| Total | 1 | 89 | 90 |
Table 2: Two-way contingency table for vege and sex
Vegetable Intake and Sex:
- Illustrates a two-way contingency table, emphasizing the gender distribution and adherence to vegetable intake recommendations.
- Majority of participants do not meet recommended vegetable intake; only 1 female meets the recommendations.
Question 5: COVID Distribution Among Employment Levels
Figure 2:
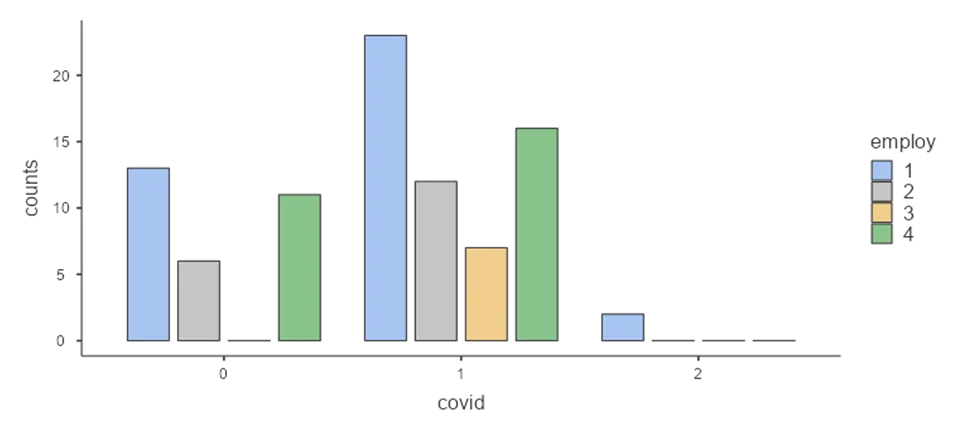
Figure 2: Bar plot showing distribution of covid among employment levels
Bar Plot:
- Displays the distribution of COVID cases among different employment levels.
- Notable patterns include full-time employed participants having the highest count in various COVID-related scenarios.
Question 6: Descriptive Statistics and Frequency Distribution
Table 1: Descriptive Statistics:
- Presents descriptive statistics for age and fruit consumption.
- Provides frequency distribution for degree, COVID status, and the year of contracting COVID.
Question 7:
Table 2: One sample t-test results
| Variable | Statistic | df | P | |
| Housewk | Student’s t | -8.10 | 88.0 | <.001 |
One Sample t-test for Domestic Work
Conducts a one-sample t-test to test the hypothesis regarding the amount of unpaid domestic work.
Test Hypotheses:
- H0: µ = 360
- H1: µ ≠ 360
Results indicate a significant difference, leading to the rejection of the null hypothesis.
This comprehensive analysis provides a detailed overview of the dataset, ensuring clarity and understanding of the applied statistical methods and their implications.