
Problem Description:
This correlation analysis assignment related to Air pollution, particularly nitrogen dioxide (NO2), poses a significant environmental challenge in urban areas.Air pollution, particularly nitrogen dioxide (NO2), poses a significant environmental challenge in urban areas. To gain a nuanced understanding of the interplay between meteorological variables and NO2 concentrations, this analysis employs a Generalized Additive Model (GAM) framework. The primary objectives include investigating the impact of meteorological factors on daily average NO2 concentrations, exploring within-year seasonal trends, assessing the efficacy of air pollution reduction measures in London, and evaluating the influence of COVID-19 lockdowns on NO2 concentrations. The findings aim to provide valuable insights for informed policy decisions towards air quality improvement.
Impact of Meteorological Variables on NO2 Concentrations:
The GAM model uncovers that three meteorological variables significantly affect daily average NO2 concentrations: air temperature (air_temp), wind speed (ws), and wind direction (wd). Notably, air temperature exhibits a positive coefficient estimate (0.300716) with a low p-value (1.74e-06), indicating a substantial positive effect on NO2 concentrations. Conversely, wind speed displays a negative coefficient estimate (-4.102385) with a negligible p-value (< 2e-16), signifying a significant negative effect on NO2 concentrations. The relationship between wind direction and NO2 concentrations is found to be nonsignificant.
Within-Year Seasonal Trends:
The analysis identifies pronounced within-year seasonal trends in NO2 concentrations. Smooth terms for year, month, and day of the year (doy) show low p-values, suggesting their influence on NO2 levels. The smooth term for the year indicates a discernible downward trend in NO2 levels from 2010 to 2021. Although specific details about the rate of decrease are not provided, this finding underscores the effectiveness of implemented measures in reducing air pollution in London.
Effect of COVID-19 Lockdowns on NO2 Concentrations:
The analysis examines the impact of COVID-19 lockdowns on NO2 concentrations in 2020 and 2021. The model estimates a decrease of 0.522671 units in NO2 concentrations during this period, revealing a sudden change attributable to pandemic-induced restrictions. The implementation of lockdown measures led to a substantial reduction in NO2 levels, emphasizing the role of reduced human activity and vehicular emissions in shaping air pollution levels.
Exceedance of WHO Daily Limits:
Model outputs indicate frequent exceedances of the World Health Organization's (WHO) daily limits for NO2 concentrations (25µg/m3). The variable "exceedance_count" reveals that the limit was surpassed 2707 times in the dataset. While the number of exceedance days varies across years, there is a general decreasing trend from 2011 to 2019, followed by a slight increase in exceedances in 2020 and 2021. This underscores the need for sustained efforts to meet WHO guidelines and further reduce NO2 exceedances.
Conclusion:
This comprehensive analysis demonstrates the substantial impact of meteorological variables on NO2 concentrations, with air temperature and wind speed identified as influential factors. Additionally, within-year seasonal trends highlight variations in NO2 levels, emphasizing the importance of considering temporal patterns in air pollution studies. The analysis reveals a noteworthy downward trend in NO2 concentrations from 2010 to 2021, showcasing the success of air pollution reduction measures in London. COVID-19 pandemic-induced lockdowns result in a sudden decrease in NO2 concentrations, underlining the role of human activity in shaping air pollution levels. However, the analysis highlights frequent exceedances of WHO daily limits, emphasizing the ongoing need for efforts to improve air quality and reduce health risks.
Appendix: Model Details:
- Family: Gaussian
- Link function: Identity
- Formula: no2 ~ air_temp + ws + wd + s(year, bs = "bs", k = 10) + s(month, bs = "cc") + s(doy, bs = "cc")
Parametric Coefficients:
- (Intercept): 46.879134
- air_temp: 0.300716
- ws: -4.102385
- wd: -0.002208
Approximate Significance of Smooth Terms:
- s(year): p-value <2e-16
- s(month): p-value 0.0105 (*)
- s(doy): p-value <2e-16
Model Statistics:
- R-sq.(adj): 0.595
- Deviance explained: 59.7%
- GCV: 92.721
- Scale est.: 92.062
- n: 3918
Exceedance by Year:
- 2011-2021: 284, 287, 317, 329, 287, 288, 262, 252, 212, 122, 162
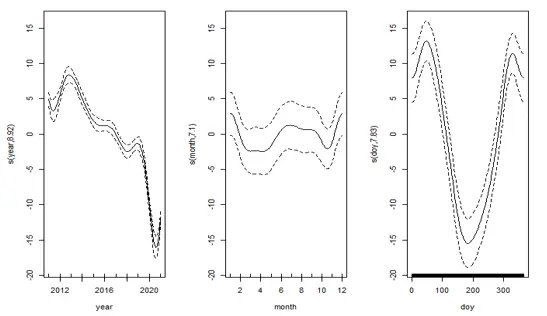
Figure 1: Significant codes with respective time zones
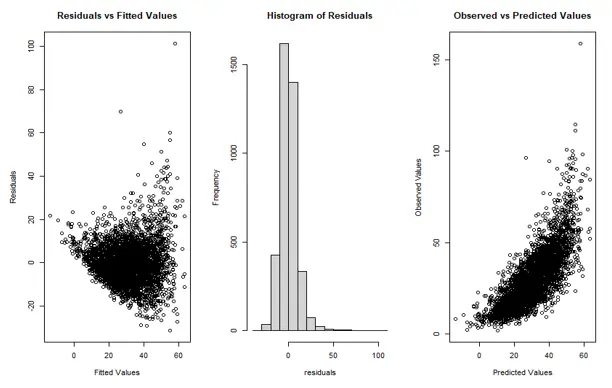
Figure 2: Approximation of the appearance of values