
Problem Description:
This week's statistical modeling assignment involves modeling the probability of snook site occupancy while considering imperfect detection. The study was conducted in 36 mangrove systems, with each site surveyed three times. The dataset includes variables such as area, percentage of exposed sand (psand), and habitat degradation (pdeg). The goal is to determine factors influencing snook occupancy and detection, generating figures based on the results.
Let’s pretend you conducted snorkeling surveys for snook in 36 mangrove systems, and you surveyed each mangrove system (a “site”) three times. The first time each site was surveyed, you recorded the following variables: area in hectares (noted as “area” in the dataset), percentage of the substrate that had exposed sand (noted as “psand” in the dataset), and as a measure of habitat quality, how degraded each site was as a percentage (noted as “pdeg” in the dataset). During each survey, you recorded the average water depth (in meters), the number of crustaceans you observed, and the number of small watercraft that passed through each site. These data are in the file “MATH 620 Week 5 assignment dataset.csv”. You know the following about this study system: Snook did not leave their “home” mangrove system over the survey period. Factors such as size, percentage of sand, and the level of degradation did not change at any sites during the study. However, because these are tidal systems, water levels change. Snook rely on blending in with the sand to capture prey, and shrimp and crabs are among their favorite food items.
1. Using a single-season occupancy model, what is the naïve snook occupancy rate and detection probability? (1 point)
Solution Presentation:
1. Naïve Snook Occupancy and Detection Probability:
Detection Probability: (Number detected)/(Number Sampled)= 41/108= 0.3796
Occupancy Rate: e0.03311465/(1+e0.03311465)= 0.5083
2. Using multimodel inference in an information-theoretic framework, which covariate, if any, best explains snook detection? (Hint: Hold occupancy constant in these models.) What evidence are you using to support this conclusion? What was the detection probability estimate from the best detection model? Provide a model selection table with model names, parameters, number of parameters, how each model ranks against one another, and the relative likelihood that a given model is best. Don’t forget to include your model from question 1. (2 points)
• Best Model: "model. depth" with ΔAIC 0.00 and Wi 0.88.
• Detection Probability Estimate: 0.8833
Table 0.1: Depth is the best explanatory variable for snook detection, as supported by AIC weights.
| Model |
K |
ΔAIC |
Wi |
|---|---|---|---|
| model.depth |
3 |
0.00 |
0.88 |
| model.null |
2 |
5.01 |
0.07 |
| model.boats |
3 |
7.10 |
0.03 |
| model.prey |
3 |
7.14 |
0.02 |
3. Using your best-fitting detection model from question 2, which variable, if any, best explains site occupancy? What evidence are you using to support this conclusion? What was the occupancy estimate from the best occupancy model? As in question 2, use multimodel inference in an information-theoretic framework to answer this question. Provide a model selection table with model names, parameters, number of parameters, how each model ranks against one another, and the relative likelihood that a given model is best. Make sure to hold the psi constant in one of these models. (2 points)
• Best Model: "model.psand" with Wi 0.7019.
• Occupancy Estimate: 0.0476 (4.76%)
Table 0.2: The proportion of exposed sand (psand) best explains snook site occupancy.
| Model |
K |
ΔAIC |
Wi |
|---|---|---|---|
| model.psand |
4 |
0.00 |
0.7019 |
| model.pdeg |
4 |
2.36 |
0.2207 |
| model.depth |
3 |
4.96 |
0.0592 |
| model.area |
4 |
7.08 |
0.0182 |
4. Assuming your best-fitting model from question three has covariates, generate publication-quality figures for the occupancy and detection covariates. Interpret these figures and what they might mean from a biological perspective. (1 point)
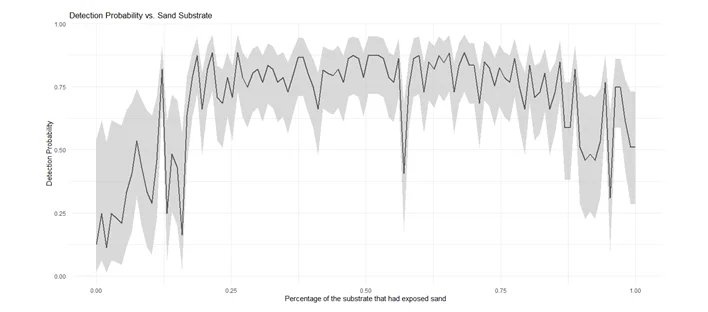
Graph 0.1: Percentage of the substrate that had exposed sand
- Occupancy vs. psand: Shows a negative relationship, implying lower occupancy with higher sand exposure.
- Detection vs. Depth: Indicates increasing detection with greater water depth.
Biologically, these findings suggest habitat characteristics influence snook detection and occupancy.
5. If you haven’t already, take a look at your second-best model from question 3. How did this model perform compared to the top-ranked model in that candidate set? Is there anything you can glean from this model that may be statistically and biologically important? To support your answer, provide the overall estimates for occupancy and detection with standard errors and a publication quality figure for occupancy, assuming this model had an occupancy covariate. Collectively, what do these results mean to you in terms of picking a “best” model and potentially ignoring others that rank below it when using model selection to make inferences? (2 points)
- Top-Ranked Model: Psand negatively influences occupancy.
- Second-Best Model: Pdeg has a marginally positive effect on occupancy.
Consider AIC values, statistical significance, and biological relevance when selecting the best model.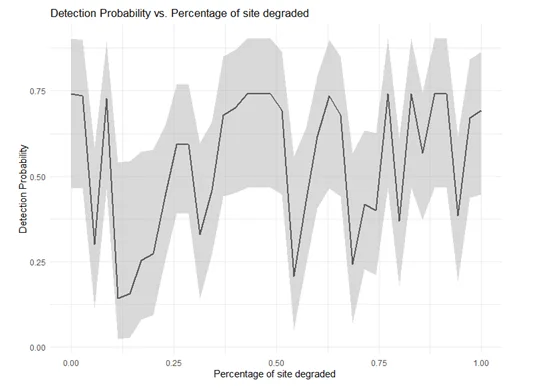
Graph 0.2: Percentage of site degraded
Conclusion
In conclusion, model selection should be based on a combination of statistical performance, biological relevance, and interpretability. Ignoring models ranked below the best model may overlook important covariates or ecological relationships. It is crucial to carefully evaluate and consider the results from different models, along with their associated uncertainties, to make informed inferences and draw meaningful conclusions about the system under study.